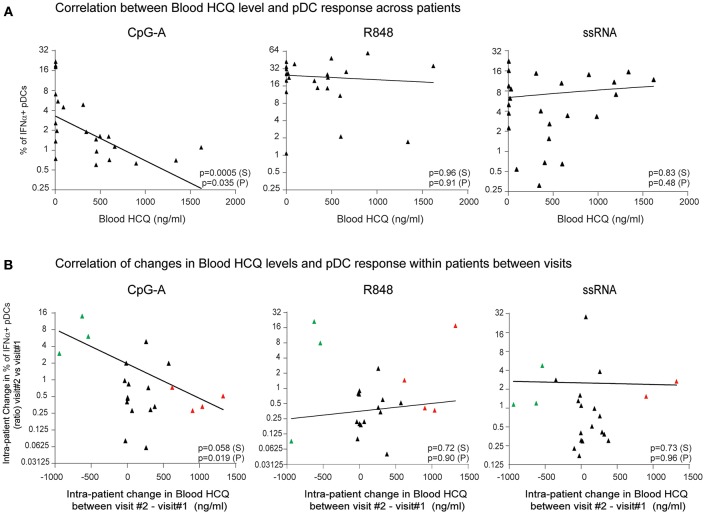
Figure 3.
The percentage of IFNα-producing pDCs upon stimulation with CpG-A, but not R848 or ssRNA, is negatively correlated with whole blood HCQ concentrations from CLE patients. (A) Association of the percentage of IFNα-producing pDCs identified by flow cytometry from PBMC after CpG-A (n = 22 donors), R848 (n = 22 donors), or ssRNA (n = 24 donors) stimulations with the HCQ concentrations in whole blood from CLE patients. Patients with non-detectable blood HCQ levels are shown at 0 ng/ml blood HCQ (B) Association of the change (ratio) between 3-month apart clinical visits in the percentage of IFNα-producing pDCs identified by flow cytometry from PBMC after CpG-A (n = 21 donors), R848 (n = 21 donors), or ssRNA (n = 22 donors) stimulation with the change in the blood HCQ concentration of CLE patients. Data points from patients with increase in blood HCQ concentration >600 ng/ml between the two visits are highlighted in red. Data points from patients with decrease in blood HCQ concentration >500 ng/ml between two visits are highlighted in green. Statistical association was assessed using Pearson's (P) and Spearman's rank (S) correlations.

