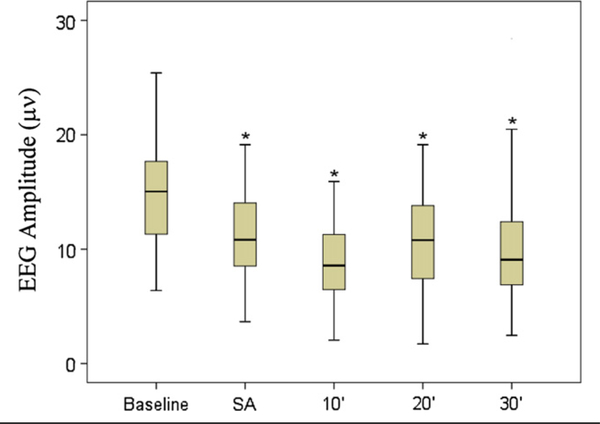
Figure 1.
EEG amplitude for channel C3-C4 in microvolts. Baseline amplitude is medication/surfactant free recording during first 10 minutes of study, followed by surfactant administration 10, 20, and 30 minutes post-surfactant administration amplitudes. * Indicates significant level of P ≤ .008. Outliers not shown on box-plot. SA, surfactant administration.

