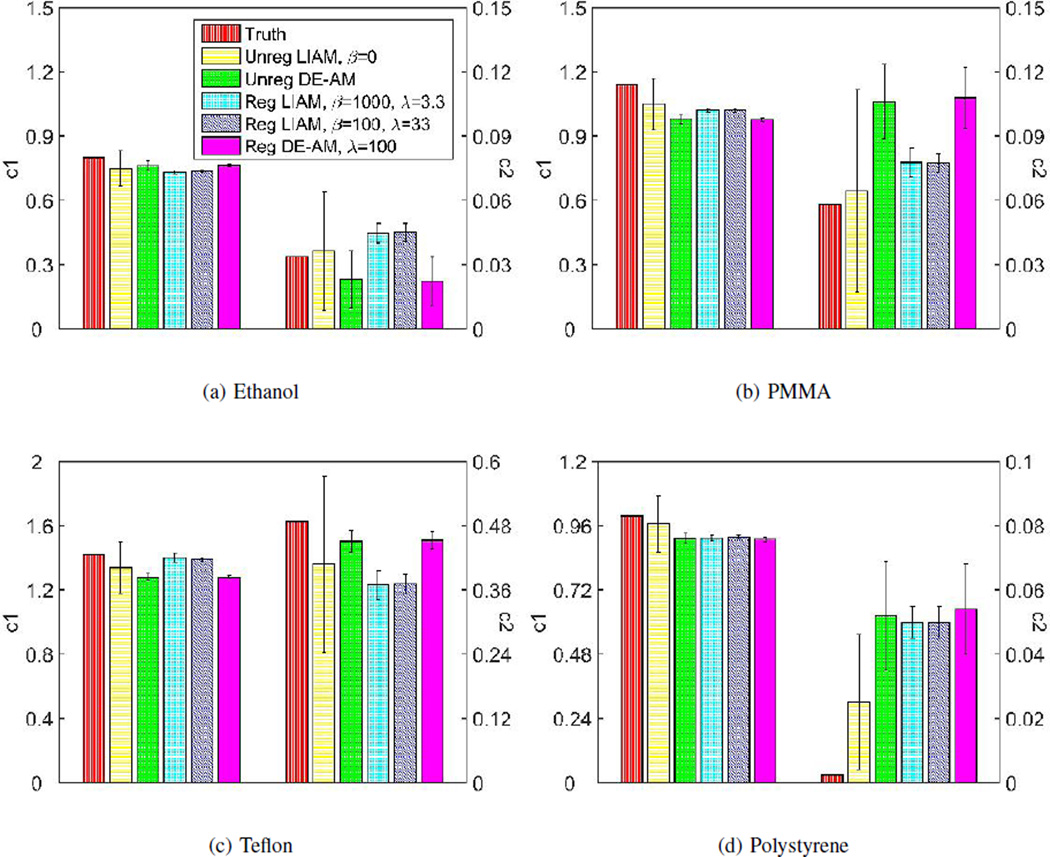
Fig. 11.
Mean and standard deviation bar chart of real data reconstruction for (a) Ethanol, (b) PMMA, (c) Teflon and (d) Polystyrene. For regularized LIAM algorithm reconstruction, results were obtained using β = 1000, λ = 3.3, δ = 500 and β = 100, λ = 33, δ = 500, respectively, for 100 iterations. For regularized DE-AM algorithm reconstruction, results were obtained using λ = 100, δ = 500 and 33 OS for 2500 iterations.

