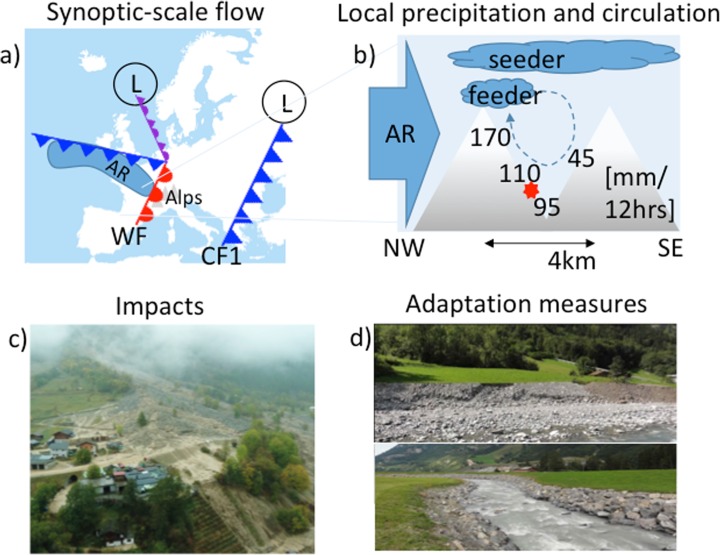
Fig. 1.
a Schematic depiction of the synoptic-scale weather situation over Europe on 10 October 2011 at 00 UTC. A warm front (WF) is located over the Alps; behind the WF, an atmospheric river (AR) reaches the western Alps from the northwest, providing a supply of moisture to the Alps. The cold front (CF1) over Greece had crossed the Alps 2 days earlier, providing heavy snowfall. The L symbols indicate the locations of the low-pressure centres associated with the two fronts. b Schematic cross-section (northwest to southeast) across the Lötschen Valley, Switzerland, illustrating the strong contrast in precipitation between the two sides of the valley; the precipitation values [mm/12 h] indicate the accumulation at several locations between 00 UTC and 12 UTC on 10 October 2011. The solid blue arrow indicates the atmospheric river (AR) and the dashed line the cavity circulation, resulting in a feeder cloud. c A mud flow blocking and damaging the only road into the Lötschen Valley, located at the red star in panel b. Figure from Bern cantonal police, used with permission. d Examples of adaptation measures implemented after the flooding: (top) a broader river bed gives the river more space to flood areas where no infrastructure or people can be harmed and (bottom) higher dams. From https://sites.google.com/a/gymneufeld.ch/hochwasserschutz-in-mitholz/schutzbauten-frueher-und-heute/neue

