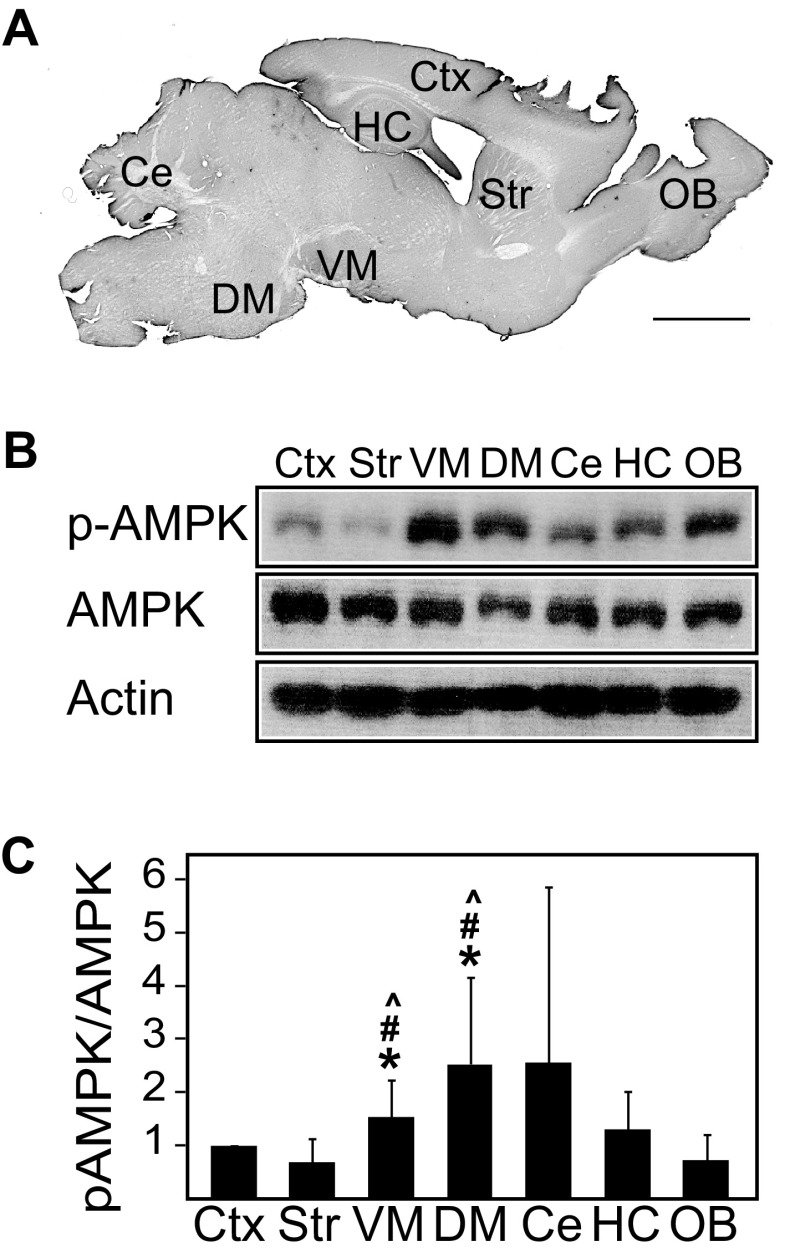
Fig. 1.
Phosphorylated AMPK/AMPK ratio varies across the different brain regions of normal mice. a Sagittal section of wild-type mouse brain depicting the location of the respective dissected brain regions (Ctx cortex, Str striatum, VM ventral midbrain, DM dorsal midbrain, Ce cerebellum, Hc hippocampus, OB olfactory bulb), scale bar = 2 mm. b Immunoblots showing the levels of pAMPK and AMPK across the different brain regions prepared from 4- to 6-month-old wild-type mice. The blots above were stripped and reprobed with anti-actin antibody to reflect loading variations. c Bar graph showing the average densitometric value of pAMPK/AMPK ratio in these regions (n = 9). (*p < 0.05 compared to Ctx, #p < 0.05 compared to Str, ^p < 0.05 compared to OB)

