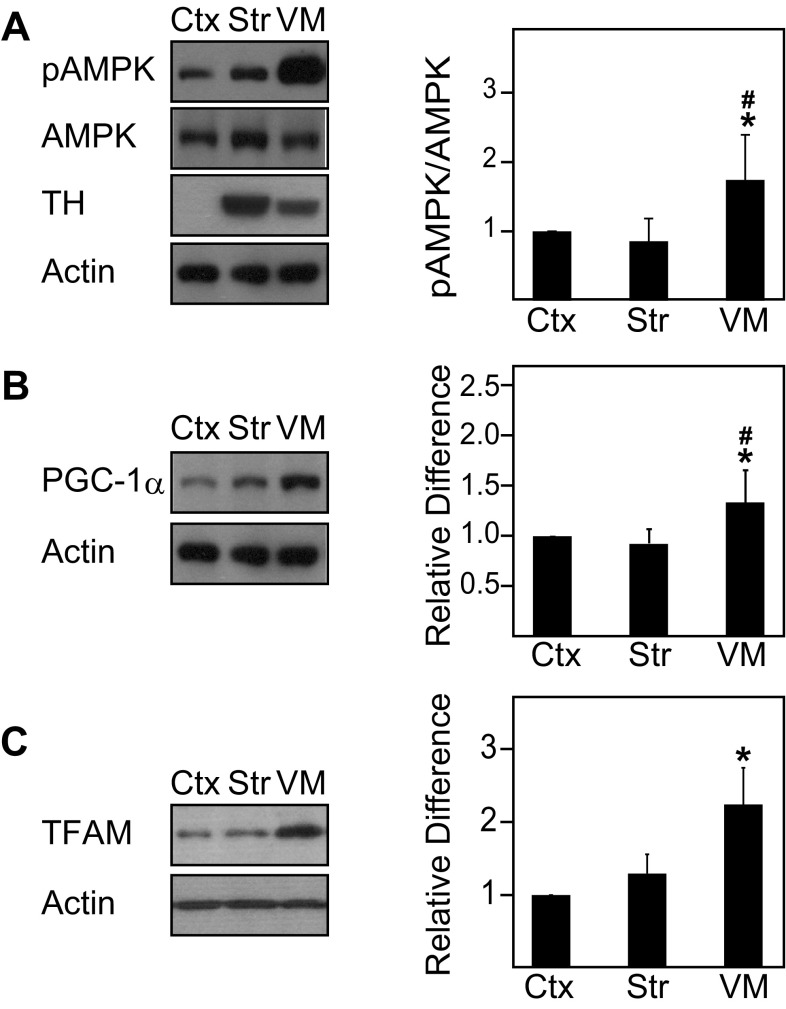
Fig. 2.
Phosphorylated AMPK/AMPK ratio, PGC-1α, and TFAM expression are significantly upregulated in the ventral midbrain region. a Left, immunoblots showing the levels of pAMPK, AMPK, and tyrosine hydroxylase (TH) in three selected regions (i.e., Ctx, Str, and VM) of the wild-type mouse brain. Right, bar graph showing the average densitometric value of pAMPK/AMPK ratio in these regions (n = 9). b Same as a except that PGC-1α expression is shown here (n = 5). c Same as a except that TFAM expression is shown here (n = 5). The blots above were stripped and reprobed with anti-actin antibody to reflect loading variations. (*p < 0.05 compared to Ctx, #p < 0.05 compared to Str)

