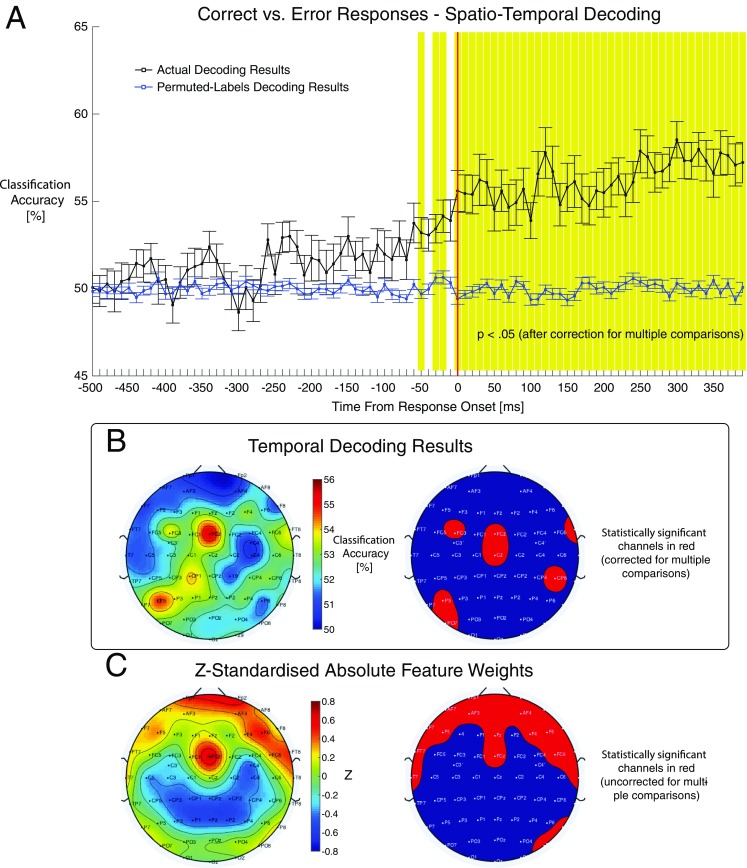
Fig. 3.

Examples of group-level results outputs produced by DDTBOX. (a) Group average classification accuracy scores by time window from response onset. The black line represents the actual decoding results, blue line is the permuted-labels analysis results. Error bars represent standard errors of the mean. Shaded time windows are statistically significant after correction for multiple comparisons. (b) Temporal decoding results. A single time window was selected for temporal decoding analyses (100-300 ms from response onset). This time range approximates the timing of the error positivity ERP component in Bode and Stahl (2014). The left scalp map plots group average classification accuracy for each channel. The map on the right highlights in red the channels showing decoding accuracy scores that were statistically significantly above zero. (c) Feature weights results averaged over time windows spanning 100-300 ms from response onset. The left scalp map displays group averages of z-standardised absolute feature weights. The map on the right highlights in red the feature channels with feature weights with z-scores that were significantly above zero
