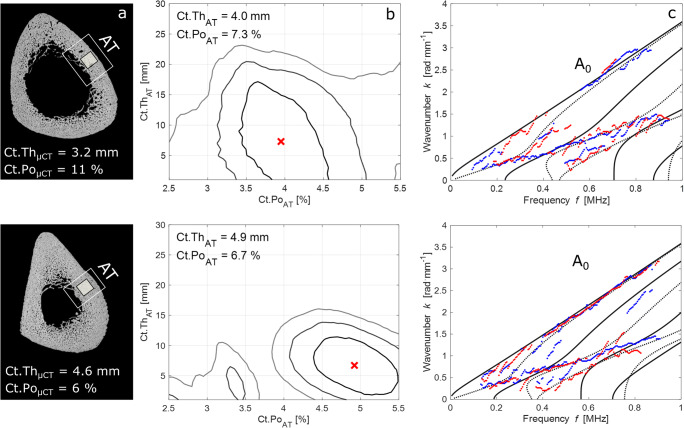
Fig. 3.
a 100-MHz scanning acoustic microscopy (SAM) images with 12 μm pixel size, showing the axial transmission (AT) measurement region. The cortical thickness (Ct.Th) below the probe was measured using μCT with 39 μm voxel size. The black square indicates the region from which a parallelepiped sample was extracted for cortical porosity (Ct.Po) measurements using μCT with 7.4 μm voxel size. b Contour plot representations of the objective functions with global maxima (crosses) corresponding to the best fit between the waveguide model and experimental dispersion curves (c). Continuous and dashed lines represent antisymmetric and symmetric modes, respectively. Red and blue dotted lines correspond to the experimental dispersion curves obtained from bi-directional guided wave measurements

