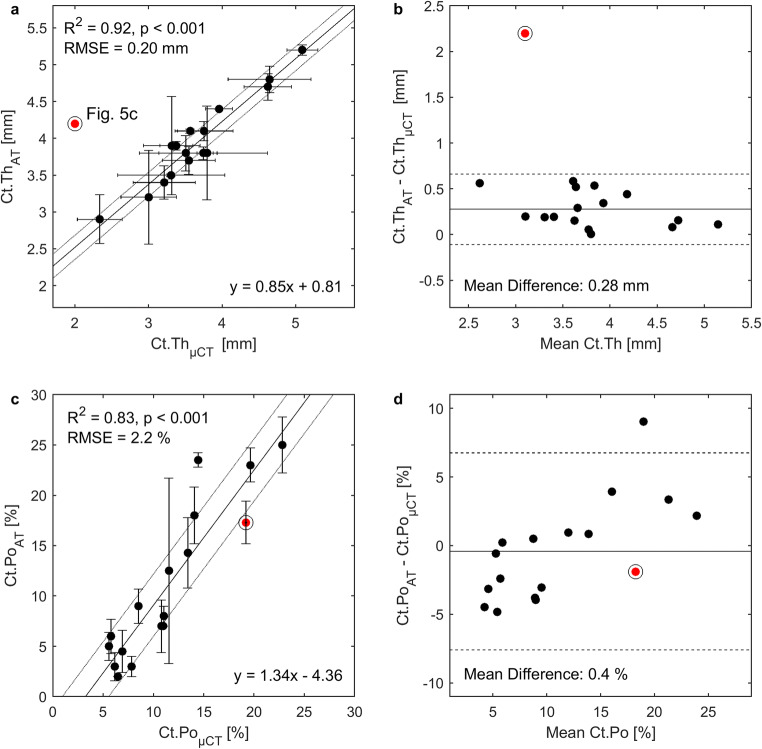
Fig. 4.
a Correlation between cortical thickness estimated from ultrasound axial transmission (Ct.ThAT) and micro-computed tomography (Ct.ThμCT) with 39 μm voxel size after exclusion of one outlier (red circled) (Fig. 5c). The correlation including the outlier was R2 = 0.57, p < 0.001, RMSE 0.37 mm. Horizontal error bars represent sample-specific Ct.Th variations in the region below the probe obtained from the full width of the distance histogram at 60% of its maximum. Vertical error bars represent standard deviations (within at least two cycles). b Mean difference and lines of according Bland-Altman plot were calculated without outlier. Mean difference including the outlier was 0.39 mm and 0.28 mm excluding the outlier. c Correlation between cortical porosity from AT (Ct.PoAT) and μCT with 7.4 μm voxel size (Ct.PoμCT). d According Bland-Altman plot. Solid lines represent fitted linear regression curves (a, c) and mean values (b, d). Dotted lines in (a, c) represent RMSE. Dashed lines and in (b, d) indicate 95% confidence intervals at ± 1.96 SD. N = 17

