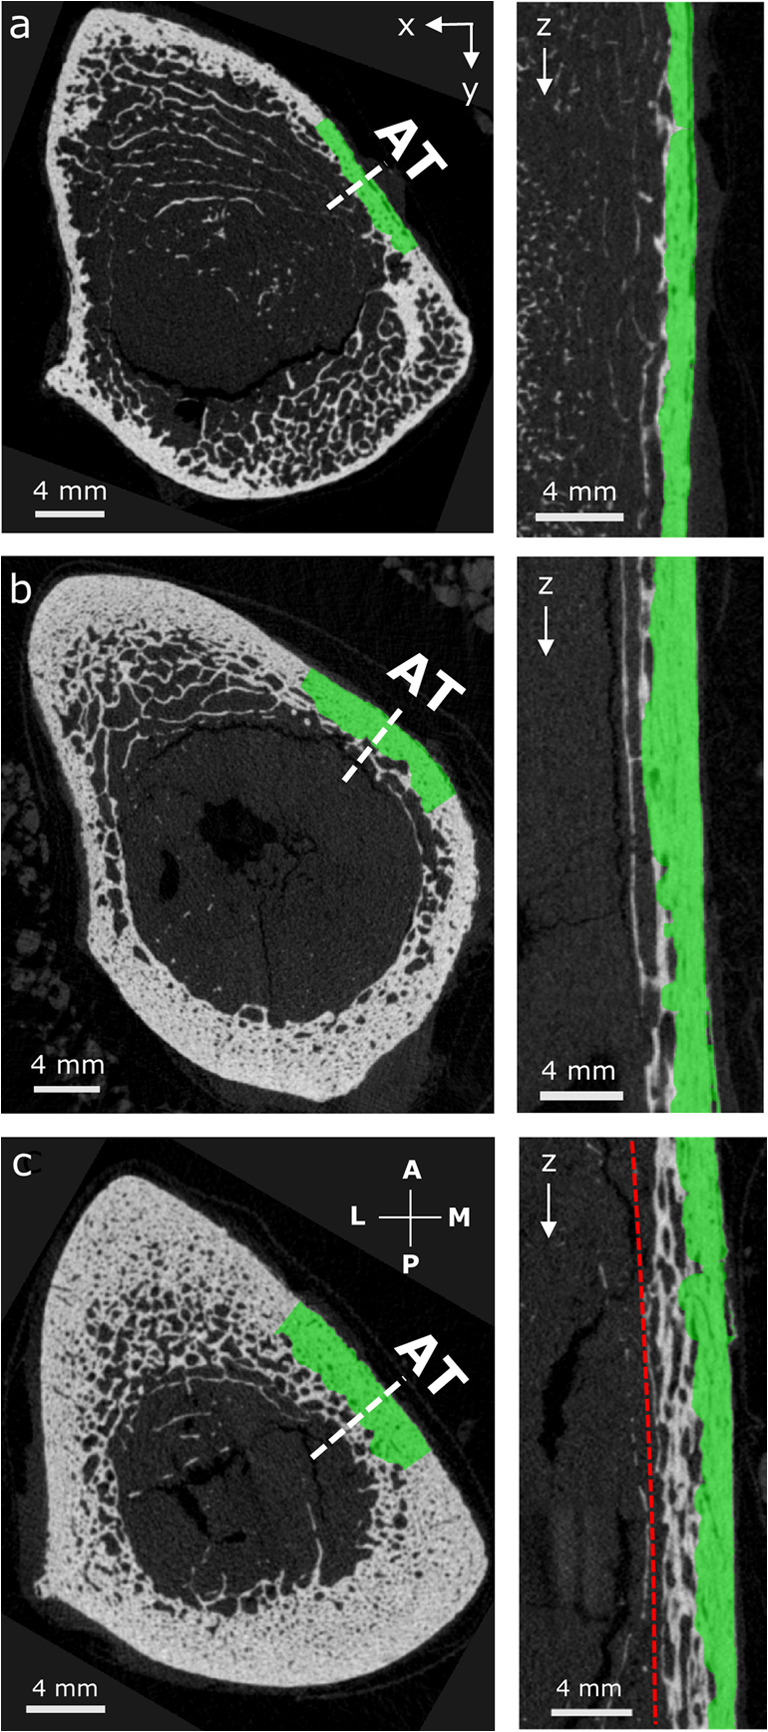
Fig. 5.

Images obtained from μCT stacks of 795 slices with 39 μm isotropic voxel size. Longitudinal sections (right) were taken at the dashed line in the cross sections (left) where axial transmission (AT) was performed. The segmented cortex mask, used to calculate site-matched vBMD and CtThμCT, is shown in green. a, b AT failure cases. c Outlier sample with heavily trabecularized cortex (indicated by a circle in Fig. 4). Here, the measurement of a reference CtThμCT (green) does not agree with CtThAT (red line). The cross sections were rotated according to the anatomical alignment: A anterior, M medial, P posterior, and L lateral
