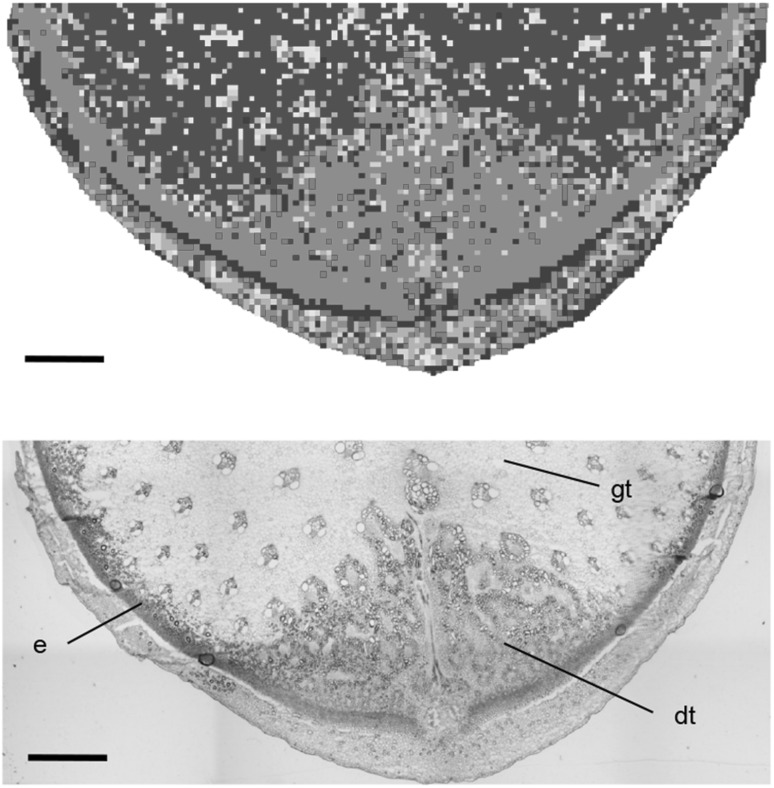
Fig. 2.
Segmentation of detected mass features. Upper. The map highlighting the result in the segmentation analysis. All mass features were divided into seven colored groups (purple, red, orange, yellow, light green, blue, and green) in this case. Lower. Light microscopy in the sections stained using toluidine-blue O. dt developing tissue, e epidermis, gt ground tissue. Bar indicates 1 mm

