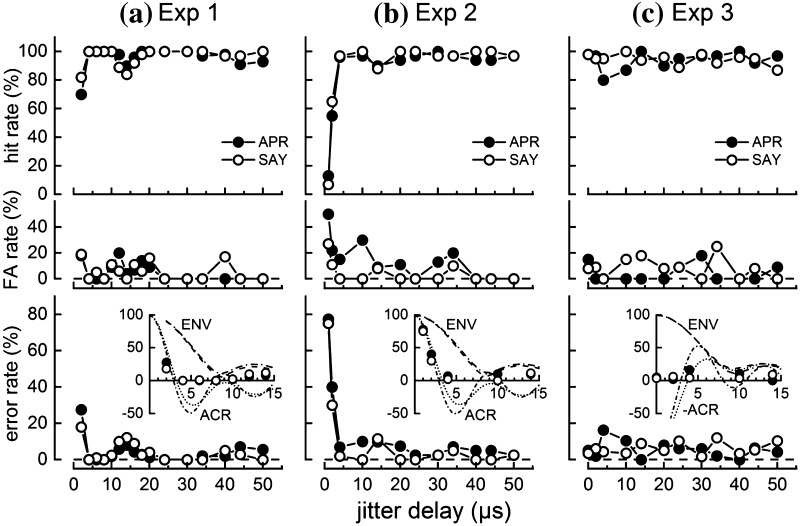
Fig. 4.
Performance of the dolphins APR and SAY during jittered echo discrimination tasks with a Experiment 1—symmetric echo delay jitter, b Experiment 2—asymmetric echo delay jitter, and c Experiment 3—symmetric echo delay and echo polarity jitter. Dolphin performance is shown in terms of the hit rate (upper panels), false alarm (FA) rate (middle panels), and error rate (lower panels). The inset graph in the lower panels compares the error rate from 0 to 15 µs to the autocorrelation (ACR) function and ACR envelope (ENV) of the click recorded by the contact hydrophone. For Exp. 3, the ACR functions are negated to reflect the cross-correlation between normal and 180° phase-shifted clicks. In the inset graphs, the ENV and ACR functions use dotted lines for APR and dot-dash lines for SAY. For Exps. 1 and 2, hit rate decreased and error rate increased for jitter delays ≤ 2 µs and between 14 and 16 µs. For Exp. 3, error rates were < 20% at all values of jitter delay, including zero

