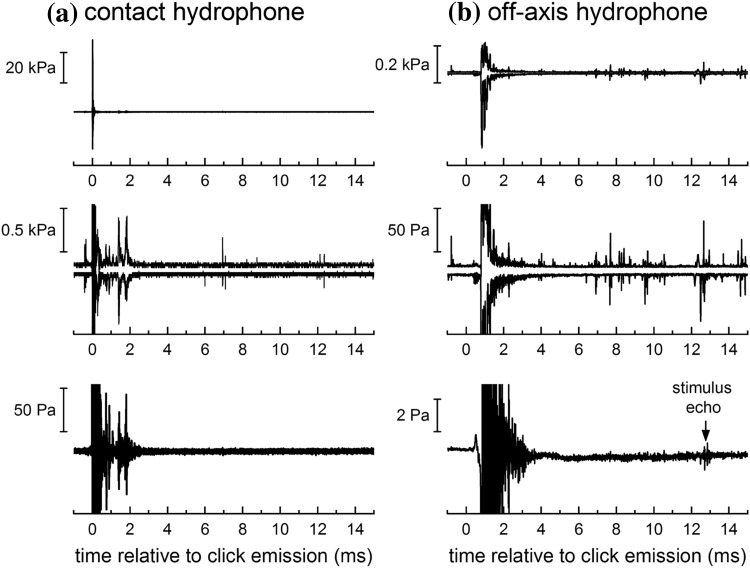
Fig. 5.
Instantaneous sound pressure recorded on the a contact hydrophone and b off-axis hydrophone over 16-ms time periods temporally aligned with the emitted clicks from a single, representative trial. The top and middle panels show the same data—the maximum and minimum sound pressure at each time sample—but with different y-axis scale factors. The lower panels show the mean sound pressure at each time sample. Impulsive signals from snapping shrimp or other dolphins are visible in the minimum/maximum data; however, the mean sound pressures reveal no visible reflections/reverberation from the apparatus and netted enclosures beyond ~ 4 ms relative to click emission

