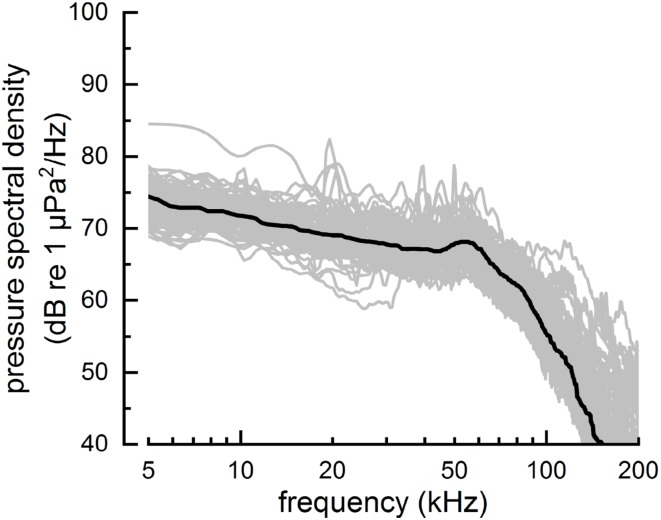
Fig. 7.
Ambient noise levels during experimental sessions were quantified by computing the pressure spectral density from the off-axis hydrophone signal over 4096-sample (~ 2 ms) time intervals, just before the generation of each echo. Each of the lighter traces shows the mean pressure spectral density for a single session. The thick line shows the smoothed median value

