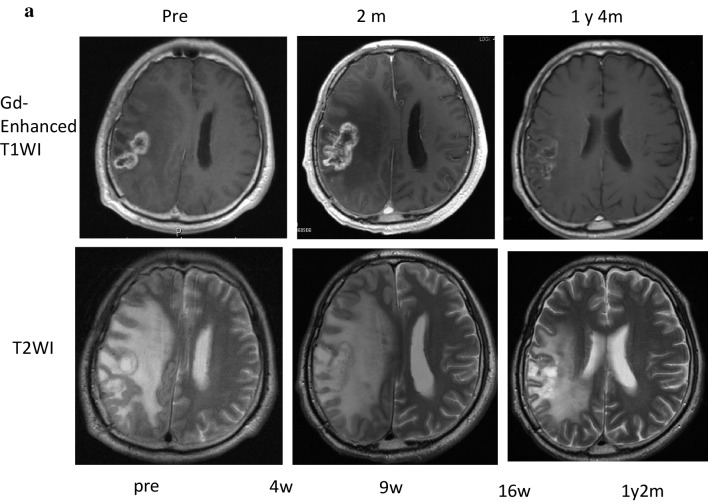
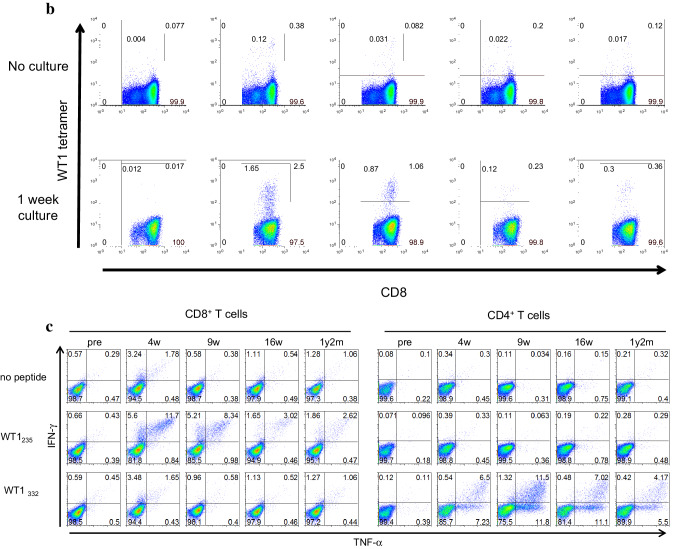
Fig. 5.
Clinical course and immune-monitoring of patient 6. a Magnetic resonance imaging (MRI) results are shown at three time points: pre-, 2 months (2 m) and 1 year and 4 months (1 y 4 m) post-WT1 vaccination. Upper and lower columns show Gadolinium (Gd)-enhanced weighted imaging (Gd-enhanced WI) and T2 weighted imaging (T2WI), respectively. FACS analysis for WT1 tetramer FACS analysis for WT1 tetramer+ CD8+ T cells. Dot blots of WT1 tetramer+ CD8+ T cells are shown pre- and at 4 weeks, 9 weeks, 16 weeks, and 1 year and 2 months post-WT1 vaccination. Upper and lower columns show tetramer assay without and with 1-week culture of PBMCs, respectively. c FACS analysis of cytokine-producing CD8+ and CD4+ T cells. Dot blots of IFN-γ- and/or -TNF-α-producing CD8+ and CD4+ T cells are shown pre- and at 4 weeks, 9 weeks, 16 weeks, and 1 year and 2 months post-WT1 vaccination. PBMCs were not re-stimulated or re-stimulated with either WT1235 or WT1332 peptide and analyzed


