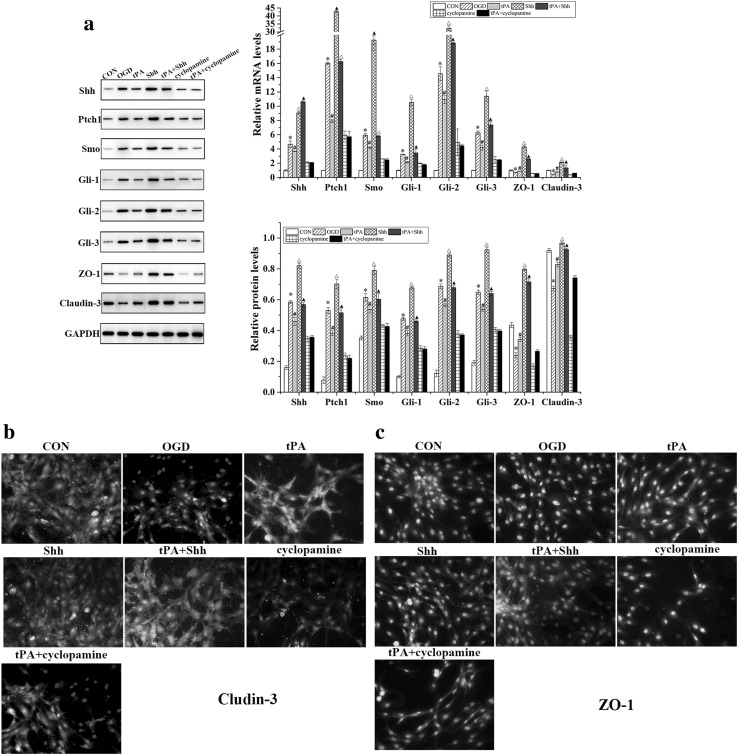
Fig. 5.
a Western blot and qRT-PCR analysis of Shh, Smo, Ptch1, Gli-1, Gli-2, Gli-3, ZO-1, and claudin-3 expression in BMECs. Bands were quantified using Quantity One 5.0. Claudin-3 (b) and ZO-1 (c) expressions were detected by immunofluorescence assay in BMECs (200 × amplification). Data are shown as mean ± SD (n = 3); *P < 0.05 versus CON group, #P < 0.05 versus OGD group, △P < 0.05 versus tPA group, ▲P < 0.05 versus Shh group

