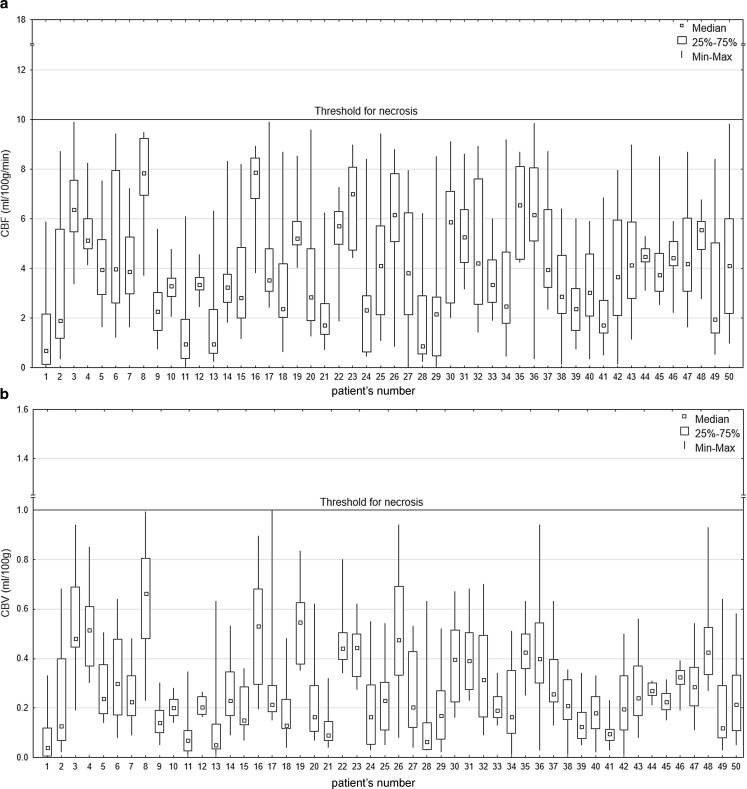
Fig. 2.
The distribution of CBF (a) and CBV (b) in 50 patients diagnosed with BD. Box plots present values obtained from 66 ROIs for each patient covering all brain regions. Data are presented as medians, 25–75% interquartile ranges, minimums and maximums. In all cases, the perfusion values are below the thresholds for nonviable tissue

