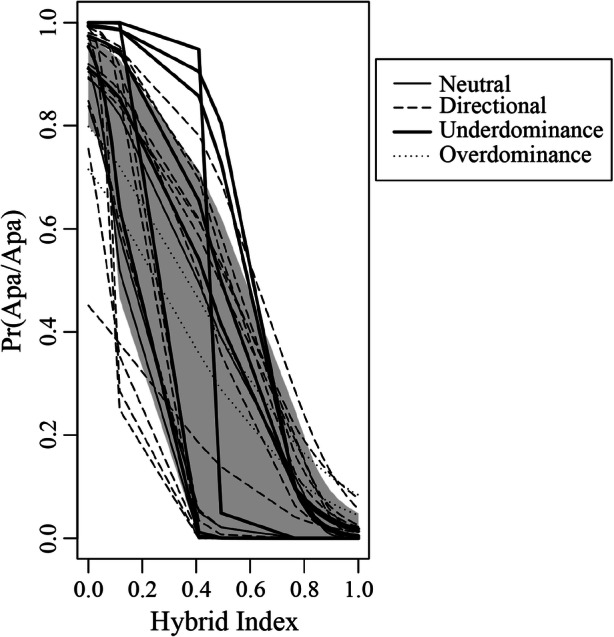
Fig. 5.

Genomic clines for 24 microsatellite (23 autosomal and one X-linked) markers and two X-linked genes, plotted as the probability of having a homozygous Alouatta palliata (Apa/Apa) genotype as a function of hybrid index, for individuals in the A. palliata × A. pigra hybrid zone in Tabasco, Mexico. Each line represents a cline for a single locus and the shaded gray area is the neutral expectation. Different line styles identify loci showing cline shape patterns consistent with particular types selection (thin solid line = neutral introgression; dashed line = directional selection; thick solid line = underdominance; dotted line = overdominance).
