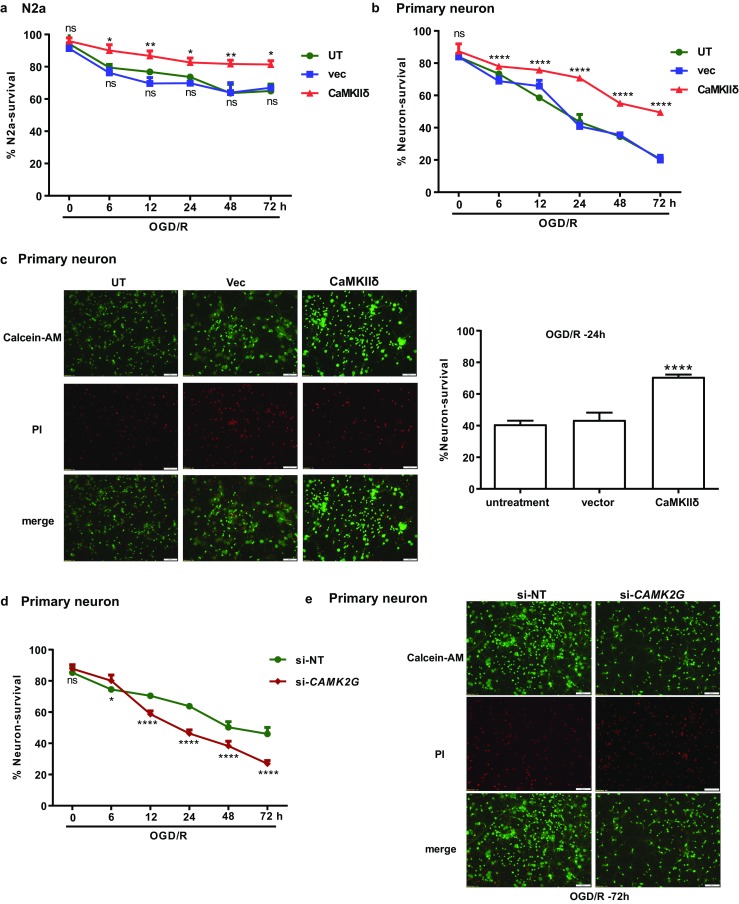
Fig. 4.

CaMKIIδ and CaMKIIγ protected neurons from OGD/R-induced cell death. a, b CaMKIIδ overexpression promoted cell survival in N2a cells (a) and primary neuronal cells (b). N2a and primary neuronal cells were transfected with the Myc-DDK-CaMKIIδ plasmid or empty vector. After 24 h, the cells underwent OGD/R treatment as described. The untransfected cells (UT) and cells transfected with the empty control vector (vec) are used as controls. Cell survival was determined by CCK-8 assay (N2a) or assessed by Calcein-AM/PI staining (primary neuron). The data in a are mean ± SEM from five independent experiments. c Images of calcein-AM/PI-stained primary neurons at OGD/R-24 h. red, PI; green, calcein-AM. Quantitative measures of live neurons (green) are shown (right). d Knockdown of CAMK2G increased OGD/R-induced cell death in primary neuronal cells. Primary neuronal cells were transfected with CAMK2G siRNA (si-CAMK2G) or non-targeting siRNA (si-NT). After 48 h, the neurons were subjected to OGD/R. Cell survival was assessed by calcein-AM/PI staining. e Images of calcein-AM/PI-stained primary neurons at OGD/R-72 h. red, PI; green, calcein-AM. The images were obtained by an Olympus 1X71 inverted system microscope and analyzed by ImageJ software. The total PI-positive or calcein-AM-positive cells were counted from ten random fields in each image. The % neuron survival was calculated as the ratio of calcein-AM-positive cell number over total cell number. Quantitative data in b–d are the mean ± SEM from at least three independent experiments. ns, not significant; *P < 0.05; **P < 0.01; ****P < 0.0001 vs. UT by two-way ANOVA
