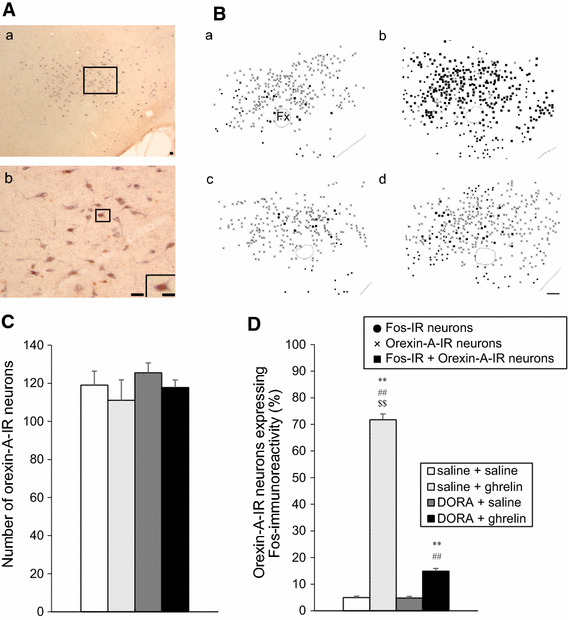
Fig. 4.

Effect of DORA, ACT462206 (15 nmol) on Fos immunoreactivity in orexin-A- immunoreactive (IR) neurons in the lateral hypothalamic area (LHA) at 90 min after intracerebroventricular (icv) administration of ghrelin (2 nmol). A Representative microphotograph showing orexin-A-IR neurons expressing Fos immunoreactivity in the LHA. A b shows an enlargement of square in A a. The inserted panel in A b is enlarged from the square. Scale bars indicate 50 μm (low magnification) and 10 μm (high magnification). B Distribution of Fos-IR neurons in the LHA at 90 min after icv administration of ghrelin (2 nmol) or saline, pretreated with DORA (15 nmol) or saline (a saline + saline; b saline + ghrelin; c DORA + saline; d DORA + ghrelin). Fos-IR neurons, orexin-A-IR neurons and colocalized neurons are indicated by circle dots, crosses and filled squares, respectively. Scale bar indicates 100 μm. C Number of orexin-A-IR neurons in the LHA, at 90 min after icv administration of solutions. Data for the number of Fos-IR neurons are expressed as the mean ± SEM (n = 5–6). D Percentage of orexin-A-IR neurons expressing Fos immunoreactivity in the LHA, at 90 min after icv administration of solutions. Data for the percentage of orexin-A-IR neurons expressing Fos immunoreactivity in the LHA are expressed as the mean ± SEM (n = 5–6). *P < 0.05 and **P < 0.01, compared with saline + saline-injected rats. # P < 0.05 and ## P < 0.01, compared with DORA + saline-injected rats. $$ P < 0.01, compared with DORA + ghrelin-injected rats
