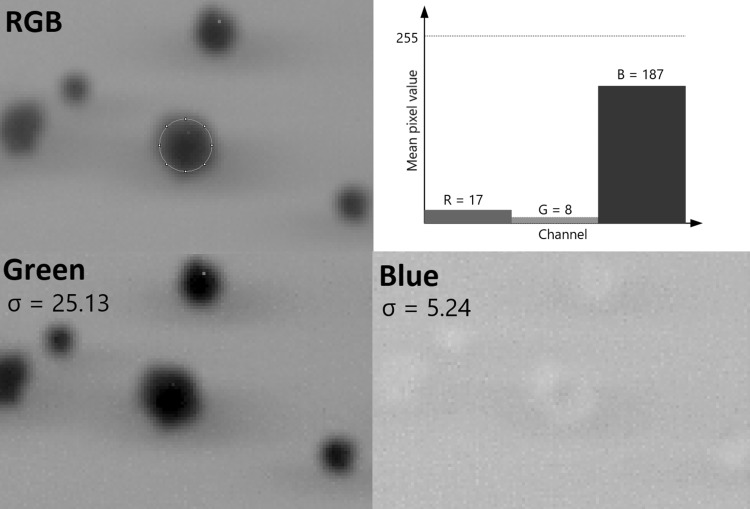
Fig. 1.
Comparison of the pixel value distribution for different stack image components. White colour in RGB scale is (255, 255, 255) while black is (0, 0, 0). The first channel is red (R), the second—green (G) and the third—blue (B; RGB). To obtain the highest contrast, the channel where the average colony pixel value differed most from the background was selected. As shown in the RGB image, the colony is mostly blue in this case, which is also displayed in the graph. In this particular image, background was more white than black (closer to (255, 255, 255) than (0, 0, 0)), therefore the channel with the lowest average pixel value was chosen. In our case, it was green. The lower figure panels demonstrate that the green channel indeed gives far better contrast than the blue. In countPHICS, the standard deviation (σ) parameter was chosen for channel selection, because it distinguishes which channel differs the most from the background in general. (Colour figure online)

