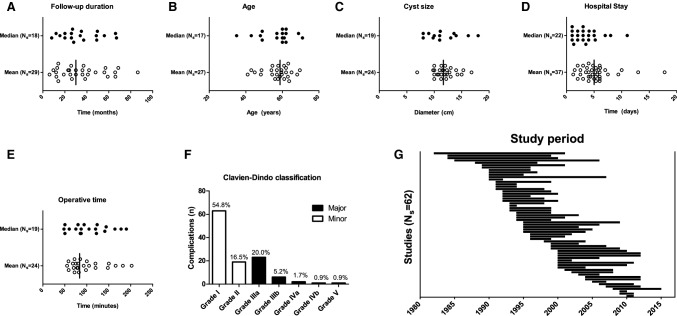
Fig. 2.
A –E Analysis of continuous data: reported medians and means, Ns, number of studies. For reported means, the vertical line represents the median of means. C Preoperative cyst size, diameter in centimetres. F Scoring of post-operative complications according to Clavien–Dindo. G Timeframes wherein patients were included (study periods) are shown per study, sorted chronologically on first inclusion

