Fig. 2.

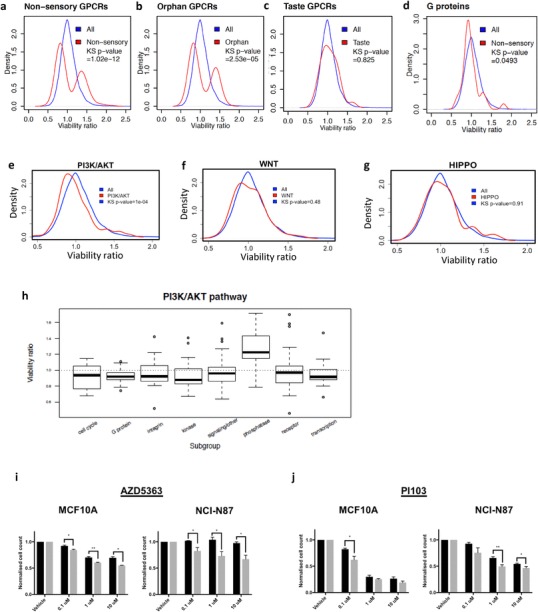
a–d Density distributions of the CDH1−/−/MCF10A viability ratios for non-sensory GPCRs, orphan GPCRs, taste GPCRs and G proteins. e–g Density distributions of the CDH1−/−/MCF10A viability ratios for signalling pathways associated with intact adherens junctions: PI3K/AKT, WNT pathway and HIPPO pathway. Pathway genes were obtained from KEGG. The statistical significance was determined using the Kolmogorov–Smirnov test. h Boxplot of the functional subgroups in the PI3K/AKT pathway. Note that all subgroups with the exception of the phosphatases are shifted in the synthetic lethal direction (viability ratio < 1). i–j Normalised cell counts 48 h after treatment with serial dilutions of AZD5363 and PI103. For each drug, both the MCF10A and NCI-N87 isogenic pair are shown (wild-type black bars; CDH1−/− grey bars). Six fields/well at 4× magnification were captured using the Cytation 5 imager (Biotek). Nuclei were counted using Gen5 (Biotek) and normalised to the vehicle control for each cell line
