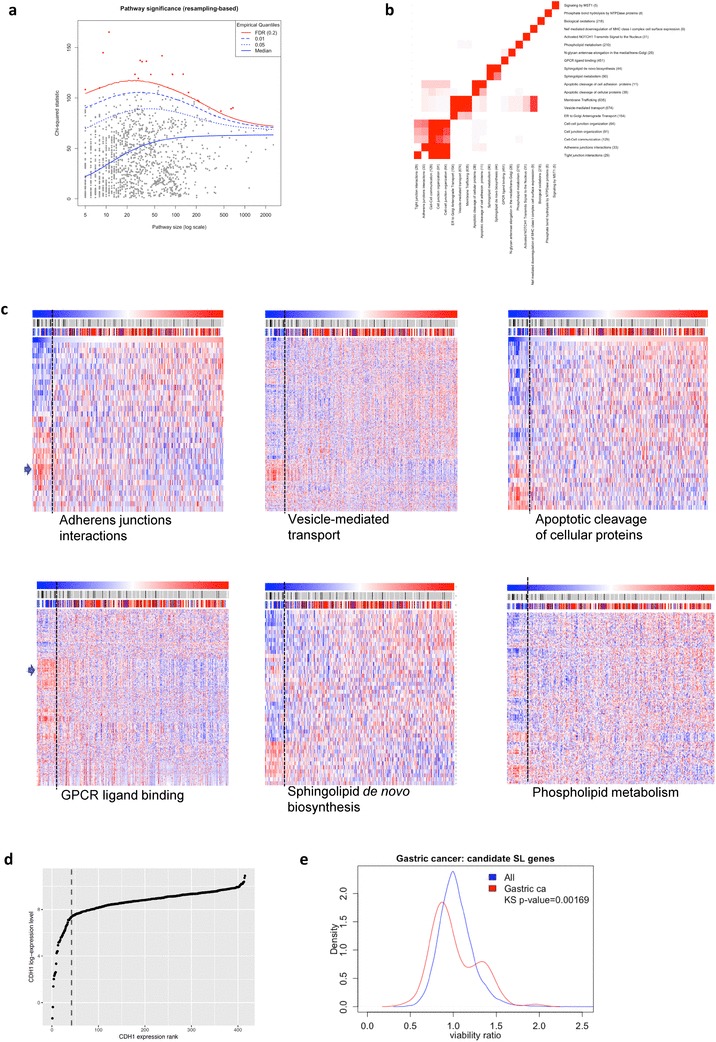
Fig. 5.

a Per-pathway chi-squared statistics for association between metagene and CDH1 expression tertiles. Blue lines indicate quantiles of the test statistic distribution under the null hypothesis, derived via resampling (500,000 iterations). Solid red line indicates significance threshold relating to control of the False Discovery Rate (FDR) at 0.2. Red dots represent pathways with FDR-adjust p values below this threshold. b Overlap in gene content between each candidate SL pathway. c Hierarchical clustering of gene expression patterns from each of six candidate SL pathways. Samples (columns) are ordered from left to right based on CDH1 expression (low to high) and the individual genes are in the rows. The Lauren classification of each tumour is marked in the bar immediately above the heatmap: blue-diffuse; red-intestinal; black-mixed; clear-undetermined. The middle bar shows CDH1 mutation status for each sample: black, mutation (of any type); grey, no mutation; clear, missing data. The vertical dashed line shows the 10% rank position for tumour sample CDH1 expression. The blue arrows mark two examples of clusters of genes with high relative expression in CDH1-deficient tumours. d Relative CDH1 expression (log2) across the TCGA stomach cancer dataset. The 10% rank position is shown by the dashed line. Note, this line marks an inflexion point in the absolute E-cadherin expression level. e Density distributions of CDH1−/−/MCF10A viability ratios for 92 receptors and enzymes (excluding orphan GPCRs) that were present in the gene clusters with the highest relative expression in CDH1-deficient tumours
