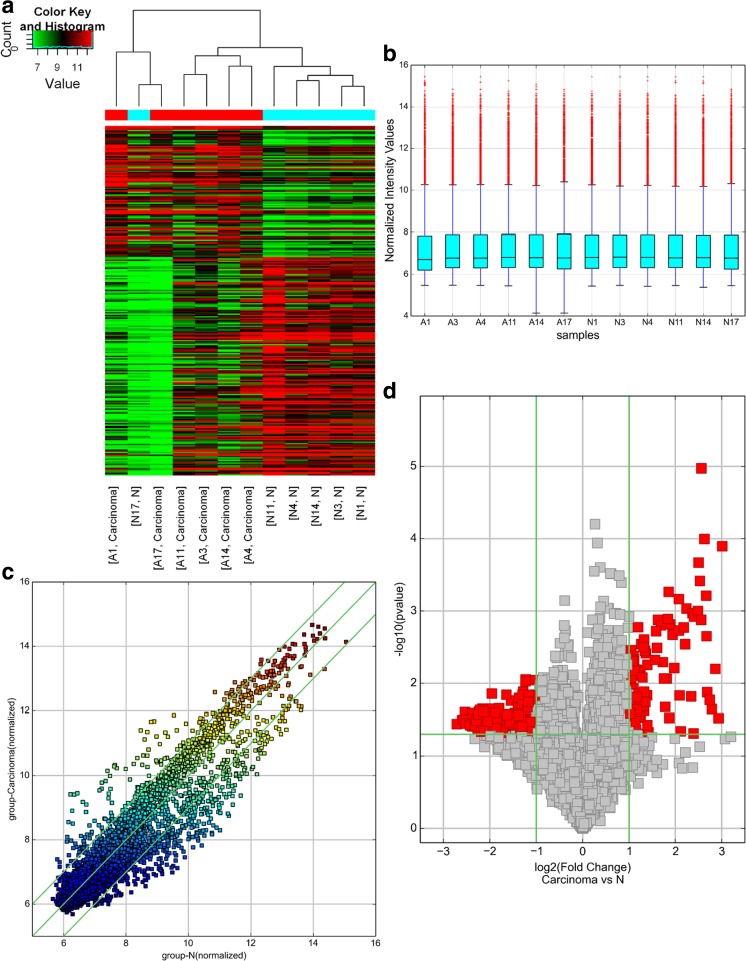
Fig. 1.
Differentially expressed circular RNA (circRNAs) in human CRC tissues (A) and adjacent normal tissues (N). a Hierarchical clustering of differentially expressed circRNAs. b The box plot shows the variations in circRNA expression. c The scatter plot explains the distribution of the data in circRNA profiles. The values of the x- and y-axes in the scatter plot were the averaged normalized signal values of the group (log2 scales). d The volcano plot illustrates the distribution of the data in circRNA profiles. The green lines in the scatter and volcano plots show the significant fold change (color figure online)

