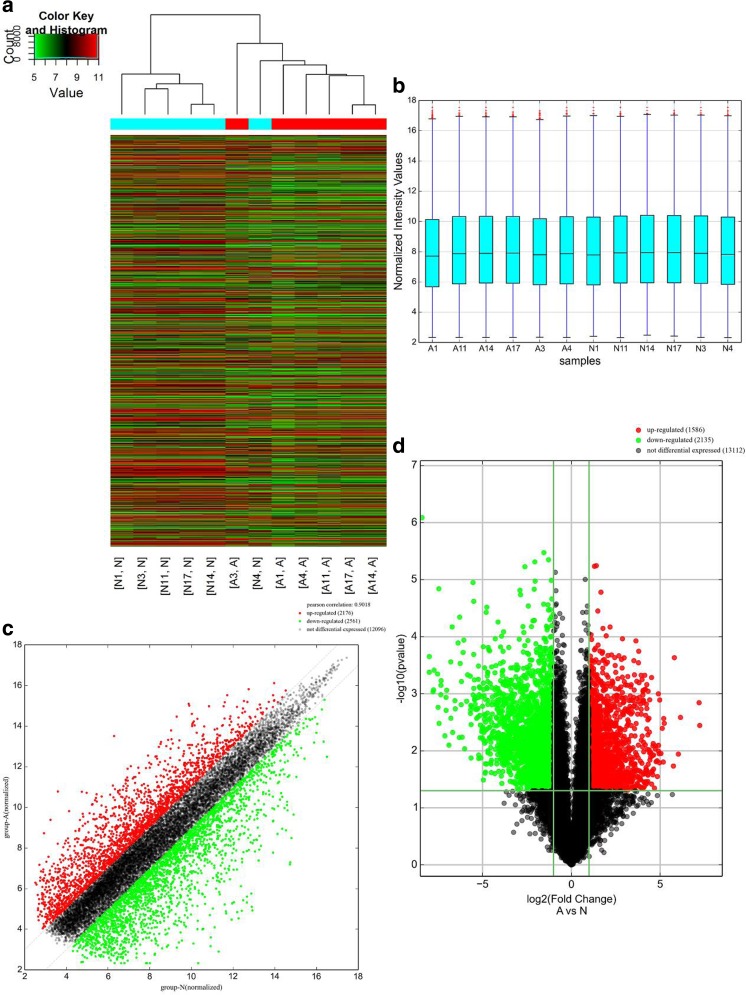
Fig. 3.
Differentially expressed mRNAs in human CRC tissues (A) and adjacent normal tissues (N). a Hierarchical clustering of differentially expressed mRNAs. b The box plot shows the variations in circRNA expression. c The scatter plot explains the distribution of the data in mRNA profiles. The values of the x- and y-axes in the scatter plot were the averaged normalized signal values of the group (log2 scales). d The volcano plot illustrate the distribution of the data in mRNA profiles. Red, green and black points in the scatter and volcano plots represent significant upregulated mRNAs, significant downregulated mRNAs and not differential expressed mRNAs, respectively (color figure online)

