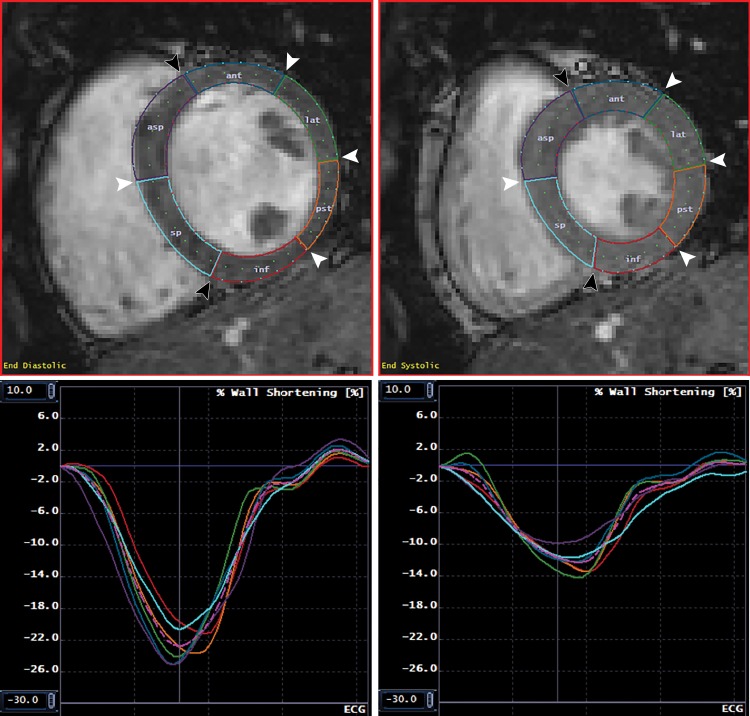
Figure 2:
Normal myocardial contours and corresponding circumferential strain. MR images show endocardial and epicardial contours and segmentation at end diastole (upper left) and end systole (upper right), with corresponding segmental and global circumferential strain curves at the endocardial (lower left) and epicardial (lower right) surfaces. Images are from a short-axis midslice in a healthy 24-year-old white man with negative genetic testing. Note that peak endocardial circumferential strain is substantially more negative than peak epicardial circumferential strain. Black arrowheads indicate the anterior and inferior septal insertion points; white arrowheads indicate the junctions between American Heart Association segments. The colored lines in the lower panels correspond to the colored segments in the upper graphs. The pink dotted line represents the mean of all segments. ant = anterior, asp = anteroseptal, inf = inferior, lat = anterolateral, pst = posterolateral, sp = inferoseptal.

