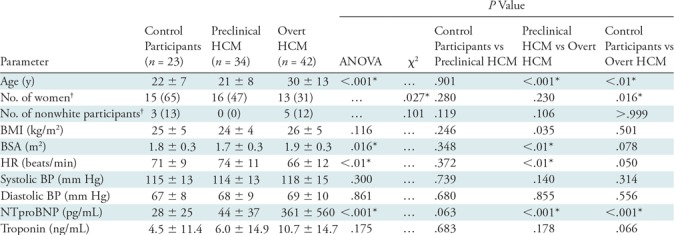
Table 1:
Baseline Characteristics of the Study Population

Note.—Unless otherwise indicated, data are mean ± standard deviation. ANOVA = analysis of variance, BMI = body mass index, BP = blood pressure, BSA = body surface area, HCM = hypertrophic cardiomyopathy, HR = heart rate, NTproBNP = N-terminal probrain natriuretic peptide.
*P values that remained significant after Bonferroni correction (with n = 3).
†Data in parentheses are percentages.
