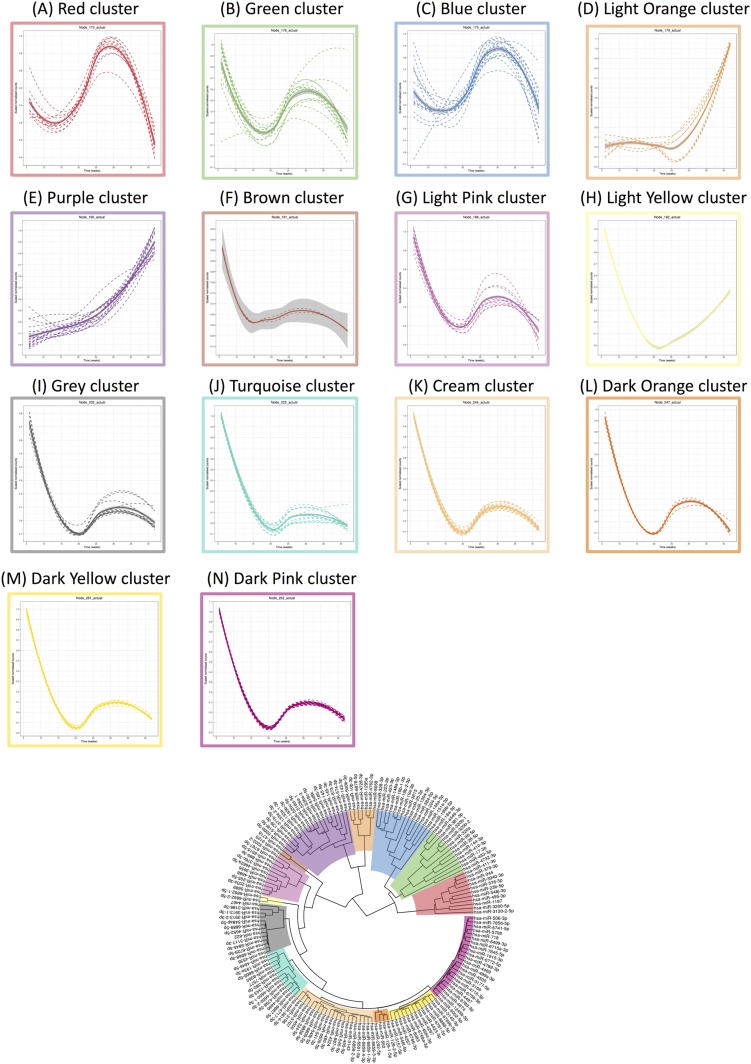
Figure 2.
Linear mixed modeling of 167 statistically significant miRNAs that change across gestation for normal pregnancies. miRNA counts were normalized using the DESeq2 package in R prior to statistical analysis using the likelihood ratio test. Subsequently, linear mixed modeling was performed on the 167 statistically significant miRNAs (P < 0.05) that change across gestation for normal pregnancies, using the lme4 package in R. The data were scaled between 0 and 1 before hierarchical clustering analysis using Euclidean distance, which is displayed as a circular cladogram (generated using the ggtree package in R). Each color of the circular cladogram represents a different cluster and its trend, as shown in (A)–(N).

