
Fig. 2.
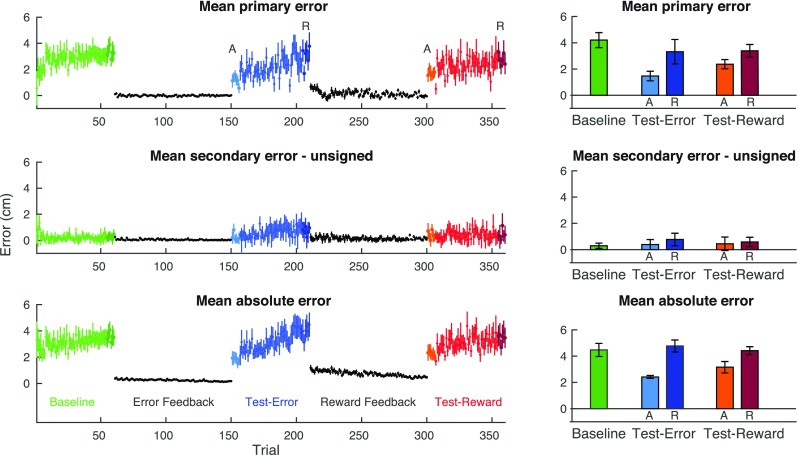
Results. Left: errors averaged across all participants (n = 12). The data are organized, such that the first learning block represents the error feedback block and the second learning block represents the reward feedback block, but the actual order of the two learning blocks was counterbalanced across participants. Right: baseline and the mean errors of the first (lighter colors, adaptation) and last six (darker colors, retention) trials of the test blocks. Error bars show SEM