
Table 2:
AUC Values Obtained on the Training and Independent Test Set by Using Different Classifiers to Distinguish Adenocarcinomas from Granulomas on CT Images
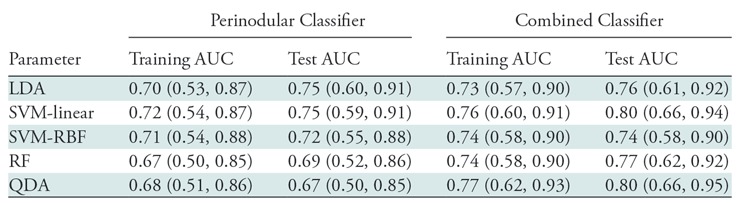
Note.— Combined classifier includes intranodular, perinodular, and shape features. Data in parentheses are 95% confidence intervals. Best performance on the independent test set was obtained by using the combined features from the nodule and its immediate parenchyma within a radial distance of 5 mm. Support vector machine (SVM) classifier with a linear kernel obtained a test area under the curve (AUC) of 80.02. LDA = linear discriminant analysis, RBF = radial basis function, RF = random forest, QDA = quadratic discriminant analysis.