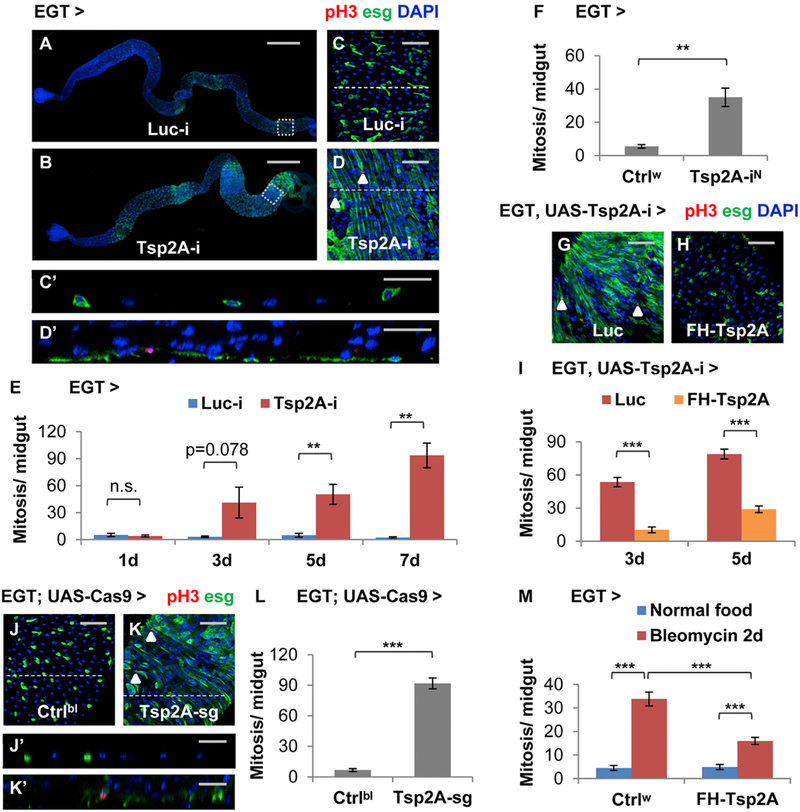
Figure 1. Identification of Tsp2A as a Suppressor of Proliferation in ISCs/EBs.

(A and B) Images showing the entire midgut with Luciferase (Luc) RNAi (the negative control) (A) or Tsp2A RNAi (B) expression in ISCs/EBs for 5 days. Scale bar, 500 mm. The GFP signal under the control of EGT labels ISCs/EBs and their recent progenies due to signal perdurance.
(C and D) The midgut expressing Luc RNAi or Tsp2A RNAi in ISCs/EBs for 5d were stained for the mitosis marker phospho-histone H3 (pH3). Scale bar, 50 μm. Examples of pH3+ cells were labeled with white arrowheads. (C) and (D) correspond to the posterior midgut regions encircled with white dashed squares in (A) and (B), respectively.
(Cʹ and Dʹ) The orthogonal projection images showing the cross-sections indicated by dashed lines in (C) and (D), respectively. Scale bar, 25 μm.
(E) Mitosis quantification of midguts expressing Luc RNAi or Tsp2A RNAi in ISCs/EBs for 1, 3, 5, or 7 days. For each genotype at each time point, at least 6 midguts were analyzed. Data are represented as mean ± SEM.
(F) Mitosis quantification of midguts expressing a different Tsp2A RNAi (from NIG, with superscript label ‘‘N’’) in ISCs/EBs for 7 days. Ctrlw (genotype: w1118) was used in genetic crosses as the control, because the genetic background is the same as NIG stocks. N = 7 or 6 midguts were analyzed for the genotype group of Ctrlw or Tsp2A-iN, respectively. Data are represented as mean ± SEM.
(G and H) pH3 staining of midguts expressing Tsp2A RNAi together with Luc cDNA (G) or FH-Tsp2A (H) in ISCs/EBs for 5 days. Scale bar, 50 μm. FH-Tsp2A is resistant to the knockdown of Tsp2A RNAi (the Bloomington stock), which targets the 3ʹ UTR region of Tsp2A. White arrowheads highlight examples of pH3+ cells.
(I) Mitosis quantification of midguts expressing Tsp2A RNAi together with Luc cDNA or FH-Tsp2A in ISCs/EBs for 3 or 5 days. N > 12 midguts were analyzed for each group. Data are represented as mean ± SEM.
(J–L) pH3 staining (K) and mitosis quantification (L) of midguts with ubiquitous expression of sgRNAs against Tsp2A and targeted expression of Cas9 in ISCs/EBs for 7 days. Scale bar, 50 μm. Flies with the same genetic background but only empty insertional landing sites (y v; attp2) were used as the control (Ctrlbl) (J) for sgRNA. White arrowheads highlight examples of pH3+ cells. N = 10 midguts were analyzed per genotype for quantification. Data are represented as mean ± SEM.
(Jʹ and Kʹ) The orthogonal projection images showing the cross sections indicated by dashed lines in (G) and (H), respectively. Scale bar, 25 μm.
(M) Mitosis quantification of midguts with or without FH-Tsp2A expression in ISCs/EBs for 5 days, with or without bleomycin feeding for the last 2 days before dissection. Ctrlw flies were used as the control in genetic crosses for FH-Tsp2A overexpression. N = 12 midguts were analyzed for each group. Data are represented as mean ± SEM.
