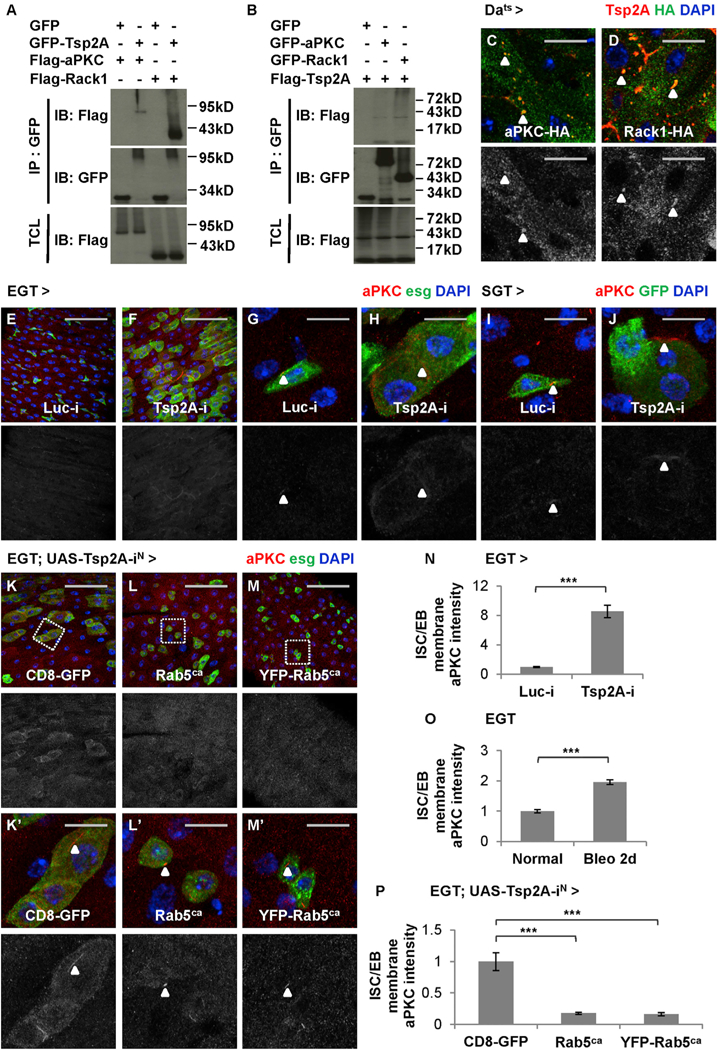
Figure 7. Tsp2A Functions as an Adaptor Facilitating aPKC/Rack Degradation.

(A and B) S2R+ cell extracts expressing GFP or GFP fusion proteins are subjected to immunoprecipitation with GFP-Trap beads. IB, immunoblot; IP, immunoprecipitation; TCL, total cell lysate. GFP-Tsp2A co-precipitates with FLAG-aPKC and FLAG-Rack1 (A), whereas both GFP-aPKC and GFP-Rack1 co-precipitate with FLAG-Tsp2A (B). Note that the expected size of Tsp2A (without any tag) is 26.9 kDa and that the bands larger (appear as smears) or smaller than expected could represent modified or degraded forms of Tsp2A, according to a previous report (Izumi et al., 2016).
(C and D) Midguts expressing HA-tagged aPKC-HA (C) or Rack1-HA (D) are co-stained with anti-Tsp2A and anti-HA antibodies. Scale bar, 10 μm. Single z stack images are presented. The green channels of HA staining are presented in grayscale below the merged images. Arrowheads indicate examples of aPKC or Rack1 co-localization with Tsp2A punctae.
(E–H) Regular (E and F; scale bar, 50 μm) or high-magnification (G and H; scale bar, 10 μm) confocal images showing aPKC staining of midguts expressing Luc RNAi (E and G) or Tsp2A RNAi (F and H) in ISCs/EBs for 3 days. The red channels are presented in grayscale below the merged images (in E–M and Kʹ–Mʹ). Arrowheads highlight examples of membrane-localized aPKC staining.
(I and J) High-magnification images showing aPKC staining of midguts expressing Luc RNAi (I) or Tsp2A RNAi (J) in EBs for 7 days. Scale bar, 10 μm. Arrowheads indicate examples of concentrated aPKC staining.
(K–M) aPKC staining of midguts expressing Tsp2A RNAi together with CD8-GFP (control) (K) or Rab5ca (2 different lines, with, M, or without, L, YFP tag) in ISCs/ EBs for 5 days. Scale bar, 50 mm.
(Kʹ–Mʹ) High-magnification images of regions encircled with wash dashed squares in K–M. Scale bar, 10 mm. Arrowheads indicate aPKC staining.
(N) Quantification of relative aPKC signal intensity on the membrane of ISCs/EBs expressing Luc RNAi or Tsp2A RNAi for 3 days. N = 32 cells from 4 midguts were analyzed for each genotype. Data are represented as mean ± SEM.
(O) Quantification of relative aPKC staining intensity on the membrane of ISCs/EBs in midguts from young adult flies on normal food or on bleomycin food for 2 days before dissection. N = 30 cells from 3 midguts were analyzed for each group. Data are represented as mean ± SEM.
(P) Quantification of relative aPKC signal intensity on the membrane of ISCs/EBs expressing Tsp2A RNAi together with CD8-GFP, Rab5ca, or YFP-Rab5ca for 5 days. N = 18 cells from 3 midguts were analyzed for each genotype. Data are represented as mean ± SEM.
