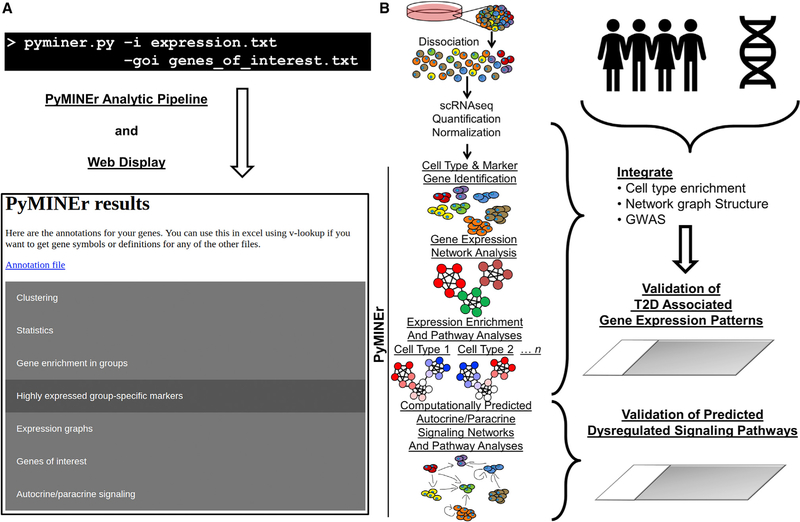
Figure 1. PyMINEr Pipeline and Implementation for scRNA-Seq.
(A) An example command line input for running PyMINEr, for which the only required argument is the input file. If you have genes of interest however, this can also be provided. At the end of a PyMINEr run, an interactive html file organizing and describing the results is generated.
(B) The PyMINEr analytic pipeline as utilized in this study. We used PyMINEr to analyze scRNA-seq, identify cell types, and generate expression graph networks integrated with Z score enrichment for each cell type. Integration of the graph structure and cell type enrichment analyses with GWAS data enabled the identification of several previously undescribed cell type-specific expression patterns for poorly described type 2 diabetes (T2D)-associated genes. The automated generation of autocrine and paracrine signaling networks through PyMINEr enabled confirmation of hypotheses predicted for the diseased human cystic fibrosis pancreas, where cellular compartments are remodeled.
See STAR Methods and Figures S1–S3 for details regarding clustering methods and benchmarking.

