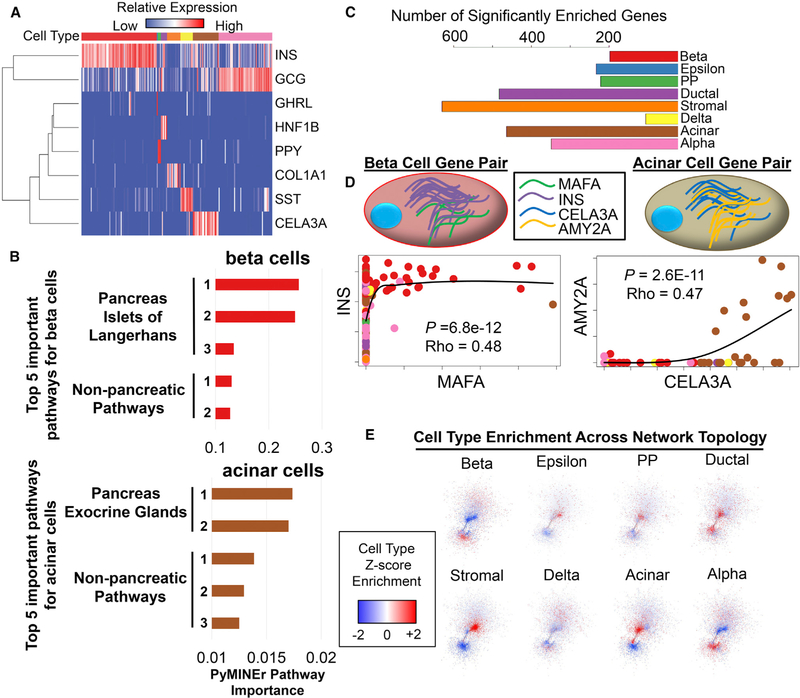
Figure 2. Characterization of Human Pancreatic Islet scRNA-Seq Gene Enrichment and Network Graphs.
(A) A heatmap of each cell type and an associated cell type marker. Cell types are color-coded along the top of the heatmap, with colors matching those in (C).
(B) The top five Human Protein Atlas (HPA) pathways for beta cells (top, red) and acinar cells (bottom, brown). Importantly, integrated pathway analyses by PyMINEr correctly identified the human body part and sub-organ.
(C) The number of genes enriched in each identified cell type as identified by PyMINEr.
(D) Examples of expression relationships that give rise to the network model of transcription based on scRNA-seq data. Cell type-enriched genes (INS and MAFA in beta cells, CELA3A and AMY2A in acinar cells) are co-expressed in particular cell types. Points in the scatterplots correspond to the expression level of the indicated gene; the identity of the associated cell is indicated by the color of the point. Of particular note are beta cells (red) and acinar cells (brown); other cell types are color-coded as in (C). Black lines show locally estimated scatterplot smoothing (LOESS) of locally weighted regressions. Spearman correlation rho and p values are shown for gene-gene expression relationships for cell type-enriched genes.
(E) Graphic representation of cell type Z score enrichment, illustrating differences in transcriptional networks across cell types. For most cell types, certain regions within the network showed transcriptional enrichment across the topology of the network.

