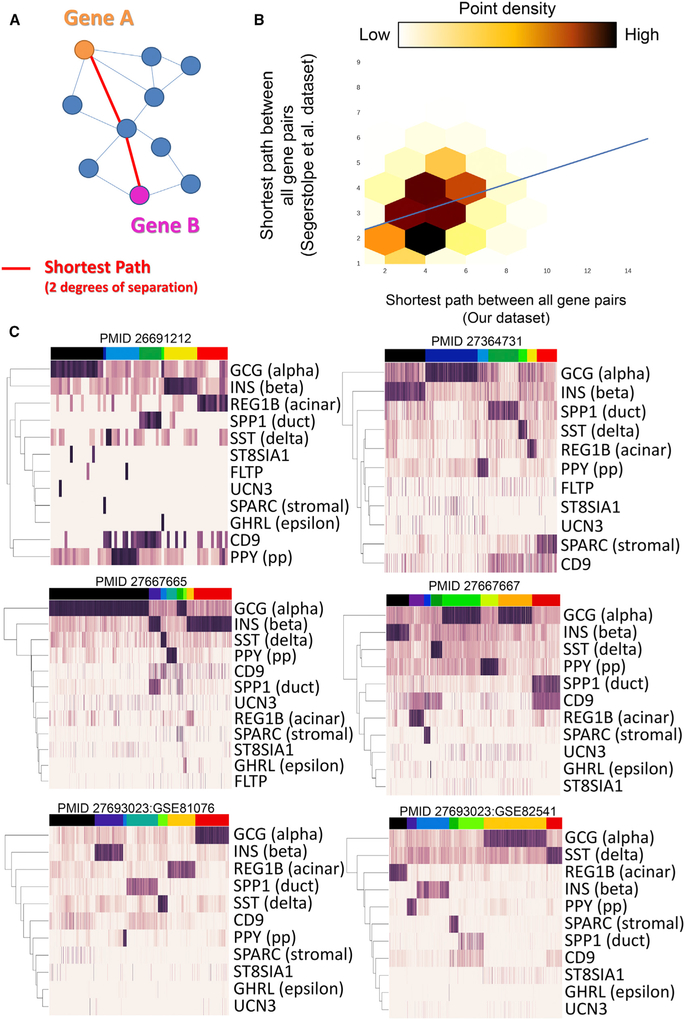
Figure 3. Graph Structure Is Conserved across Human Islet scRNA-Seq Datasets from Different Laboratories.
(A) A schematic example of the shortest path between two genes in a network. In this case, the shortest path between gene A and gene B is two, denoted by the red lines (i.e., A and B are 2 degrees of separation away from each other).
(B) The correlation corresponding to overall network structure when comparing the network built by PyMINEr using our dataset and the dataset from Segerstolpe et al. (2016). The plot indicates the shortest path between all gene-gene pairs within each network. Linear regression is shown by the blue line. These results indicate that the overall structures of the two networks built by these two datasets are similar. Of note, our dataset contained fewer cells (185) sequenced at a higher depth (average reads per cell = 2,842,414; i.e., 1,421,207 paired-end fragments). This demonstrates that, with sufficient depth of sequence, network graphs can be generated with fewer cells.
(C) Heatmaps of known and posited islet marker genes form the 6 additional datasets analyzed here. Full PyMINEr analyses for these datasets available at www.sciencescott.com/pancreatic-scrnaseq. See Figure S4 for notes regarding adjusting for variable power across datasets for constructing graph networks.

