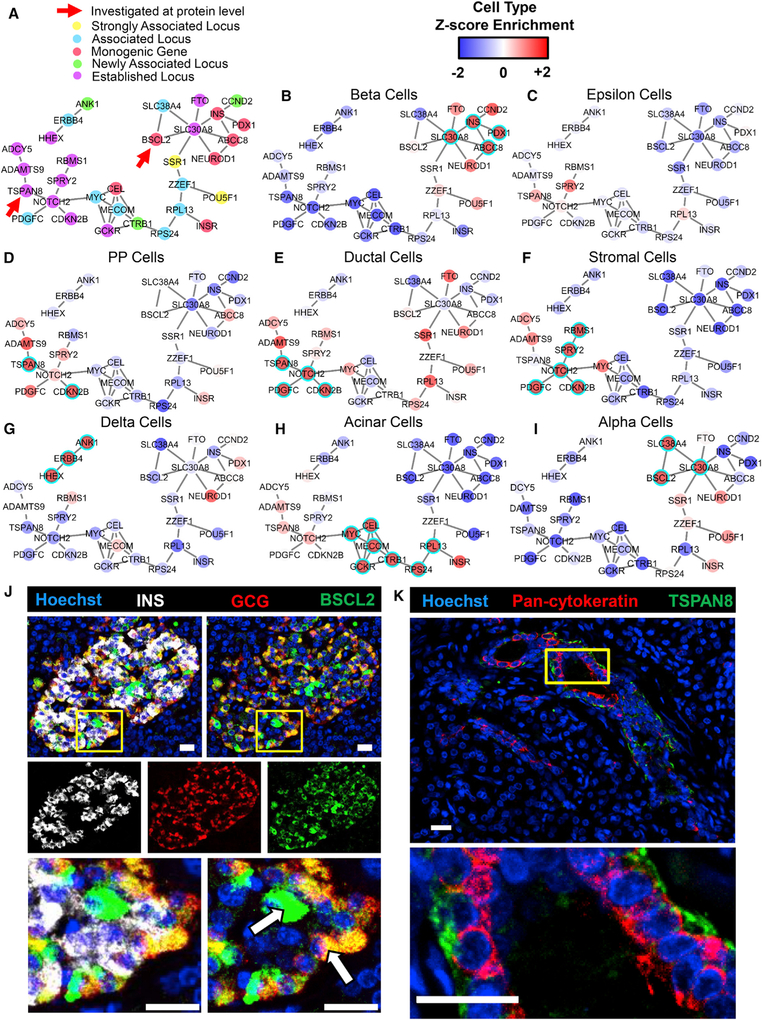
Figure 5. Cell Type-Specific Enrichment of T2D-Associated Genes.
(A) A subset of the larger networks shown in Figure 2E focused on T2D-associated genes. The nature of the associations that were previously published is indicated by color (Morris et al., 2012). Gene associations newly discovered through the cited meta-analysis are denoted as “newly associated locus.”
(B–I) The Z score enrichment of T2D-associated genes by cell type (from our dataset) are displayed over the two largest connected components of the T2D gene subset of the transcriptional network built by PyMINEr. As indicated, panels correspond to beta (B), epsilon (C), pancreatic polypeptide cells (D), ductal (E), stromal (F), delta (G), acinar (H), and alpha cells (I). Highly enriched genes are shown in red, whereas genes whose expression is low in the given cell type are shown in blue. If a gene passed the threshold for significant enrichment for the given cell type, then it is highlighted with a cyan ring. Table S2A lists cell type annotations for all T2D-associated genes, including those not shown here.
(J) Immunofluorescence staining of a human pancreas section for glucagon (GCG; alpha cells, red), BSCL2 (green), and insulin (INS; beta cells, white) and counterstaining with Hoechst dye (nuclei, blue) (n = 5). Although many alpha cells were positive for BSCL2, we also observed expression in other islet cells (examples noted with arrows).
(K) Representative immunofluorescence staining of a human pancreas section for pan-cytokeratin (highlights primarily the ductal epithelium, red) and TSPAN8 (green), with Hoechst counterstain of nuclei (blue) (n = 4).
(J and K) Higher magnifications of the areas marked by yellow boxes are shown below the primary images. All scale bars represent 20 mm.

