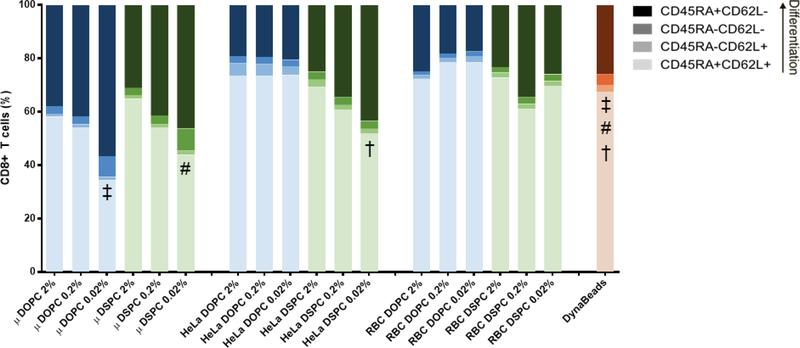
Figure 5.
Differentiation state of CD8+ T cells after 12-day outgrowth. Data represented as mean, SD omitted for legibility (n = 3 biological replicates; two-way repeated measures ANOVA with Bonferroni’s multiple comparisons test). Matching symbols indicate statistical significance between least-differentiated subpopulations of treatments compared to DynaBeads: ‡ = μSpheres DOPC 0.02% vs. DynaBeads (P < 0.0001); # = μSpheres DSPC 0.02% vs. DynaBeads (P < 0.0001); † = HeLa DSPC 0.02% vs. DynaBeads (P < 0.05).

