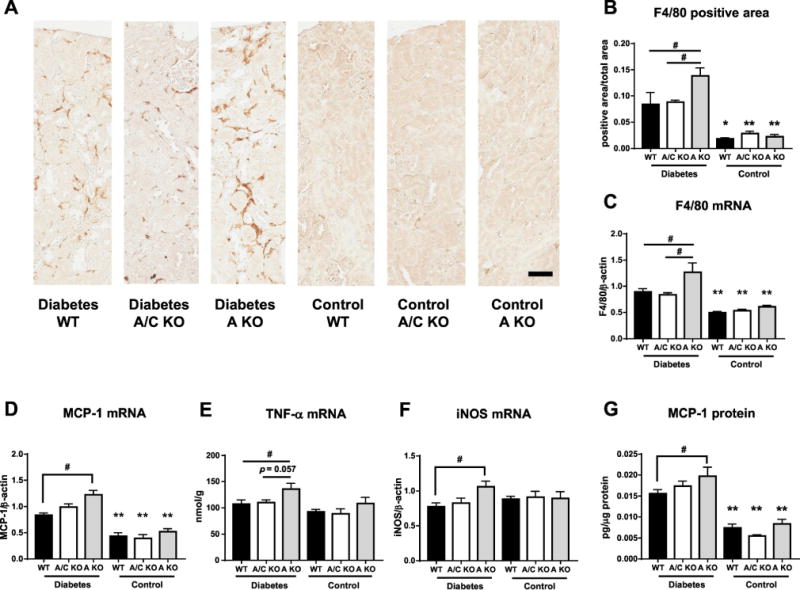
Figure 3.

Inflammation marker in kidney of streptozotocin-induced diabetic and control WT mice. (A) Representative images of F4/80 stained kidney. Scale bar = 50μm (B) Quantification of F4/80 positive area in all diabetic groups. (C-F) Quantitative PCR for mouse F4/80 (C), mouse monocyte chemotactic protein-1(MCP-1, D), mouse tumor necrosis factor α (TNF-α, E), mouse inducible nitric oxide synthase (iNOS, F), in kidney. β-actin was used as an internal control. (G) MCP-1 protein in kidney corrected for protein concentration. (A-G, Each diabetic group, n = 9-11. Each control group, n = 4-9). Data represent means ± SEM. *P < 0.05, **P < 0.01 versus the respective diabetes group. # P < 0.05.
