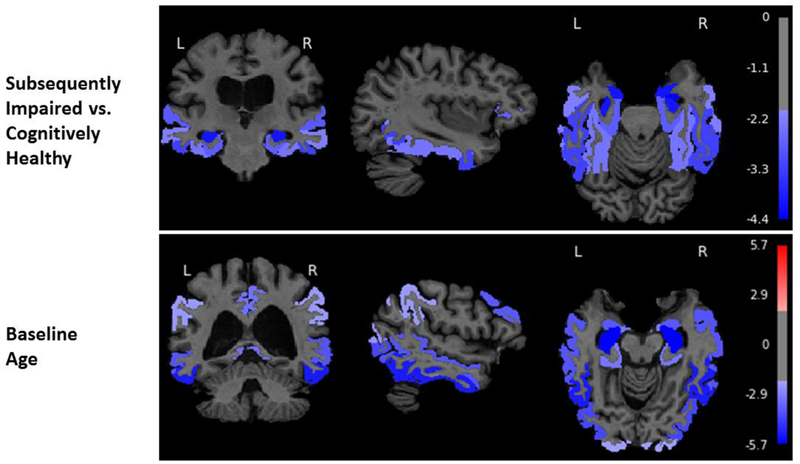
Figure 1.

Associations of diagnostic status (subsequently impaired vs. cognitively healthy) and baseline age with gray matter volume change in the overall sample from the Baltimore Longitudinal Study of Aging (N=688). The color bar represents t-values from the results of the linear mixed effects models. These models consisted of fixed effects (baseline intracranial volume (ICV), image type [1.5-T SPGR vs. 3-T MPRAGE], age, sex, diagnostic status, race, time since first MRI, and two-way interactions of image type, age, sex, diagnostic status, and race with time) and random effects (intercept and time) with unstructured covariance. We used a threshold of ±1.96 to highlight areas of either volume expansion (positive t-values) or volume loss (negative t-values). Note that the colors are uniform within regional labels since the figures depict ROI rather than voxel-based analyses.
