. 2018 Dec 3;21(1):145–154. doi: 10.1039/c8ce01726c

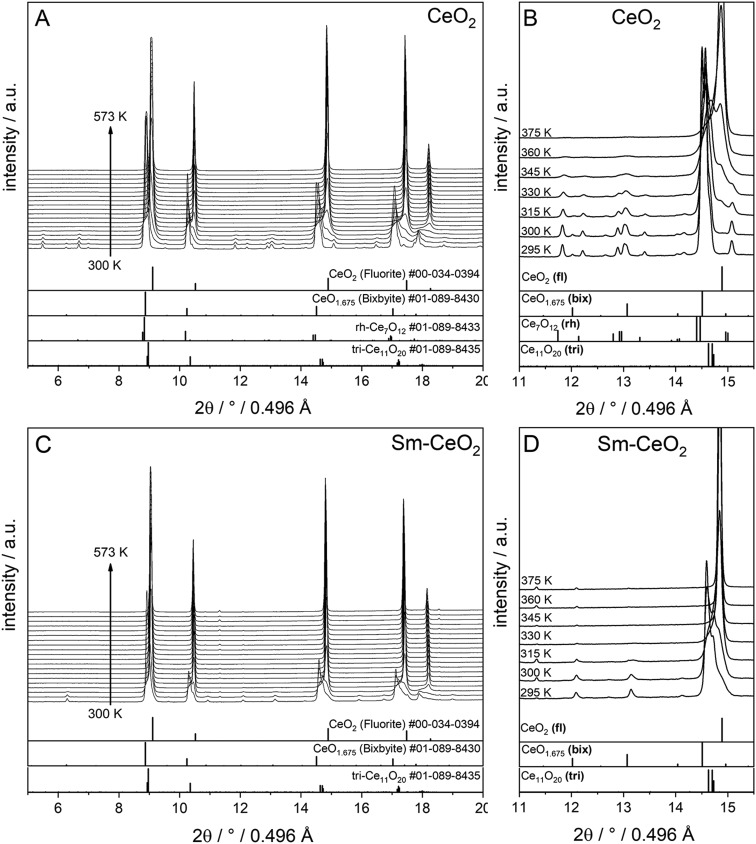
Fig. 4. In situ XRD patterns (λ = 0.4957 Å) collected during re-oxidation of CeO2 (A and B) and SDC15 (C and D) specimens in flowing O2 atmospheres directly after H2 pre-reduction. Panels A and C show in situ XRD patterns in a broad 2Θ range and in a temperature interval between 300 K and 573 K. Panels B and D focus on the some temperature regions to allow for closer analysis in a narrower 2Θ window. The calculated diffraction patterns of the fluorite CeO2, bixbyite CeO1.675, rh-Ce7O12 and tri-Ce11O20 structures are shown at the bottom. The fluorite, bixbyite, rhombohedral and triclinic phases of ceria are abbreviated as fl, bix, rh and tri, respectively, in panel B and D. The structure refinement plots of the XRD patterns in panel B and D are shown in the ESI as Fig. S5 and S6, respectively.

Fig. 4