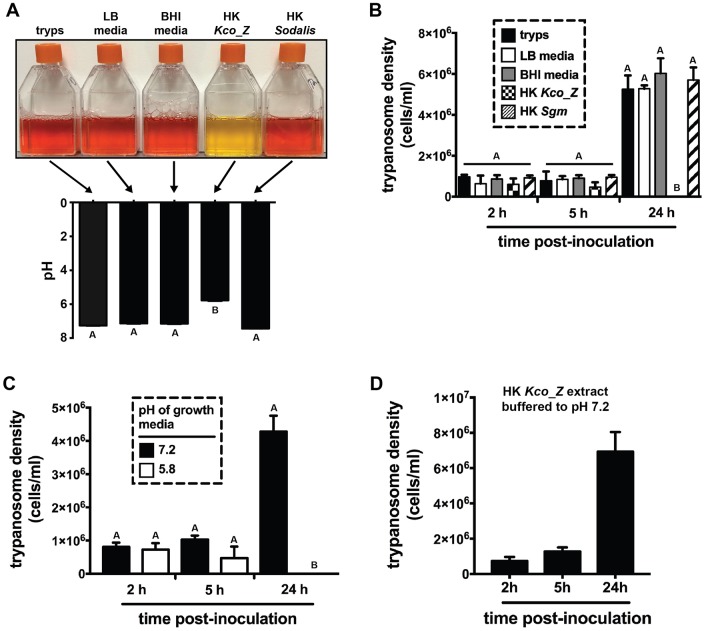
Fig 4. Kco_Z produces a low pH environment that is toxic to trypanosomes.
(A) Early log phase trypanosomes (T. b. brucei YTAT 1.1), cultured in 10ml of Beck’s medium containing the pH sensitive dye phenol red, exposed to 1ml of heat treated LB media (Kco_Z culture medium), 1ml of heat treated BHI media (Sodalis culture medium), heat killed (HK) Kco_Z (5x10⁶ cells) in 1ml of LB media and HK Sodalis (5x10⁶ cells) in 1ml of BHI media. Controls are trypanosomes alone (tryps). All heated treatments and controls were allowed to cool to room temperature prior to adding them to the trypanosome cultures. Two hours post-treatment, culture pH was measured. HK Kco_Z significantly reduced the pH of the trypanosome culture (p<0.001). The experiment was repeated using 6 distinct clonal trypanosome populations (the image represents one of the six replicates). (B) Density of trypanosomes in culture 2h, 5h and 24h after addition of the treatments described in (A) above. At the 24h time point, all trypanosomes exposed to HK Kco_Z extracts were dead while those from the other groups were replicating similarly to controls. (C) Density of trypanosomes cultured in normal (pH 7.2) and artificially produced (via the addition of 0.1N HCl) acidic (pH 5.8) environments. Artificial acidic conditions kill all trypanosomes with 24 h. (D) The density of cultured trypanosomes exposed to HK Kco_Z extracts buffered to pH 7.2 (via the addition of 0.1N NaOH). The buffering treatment rescues parasite growth. In (A), (B) and (C), statistical significance was determined using a one-way ANOVA followed by Tukey’s HSD post-hoc analysis in (A), and a two-way ANOVA followed by Tukey’s HSD post-hoc analysis in (B) and (C). Different letters represent statistical significance between treatments and controls. In (B), (C) and (D), experiments were performed using 5 or 6 distinct clonal trypanosome populations.

