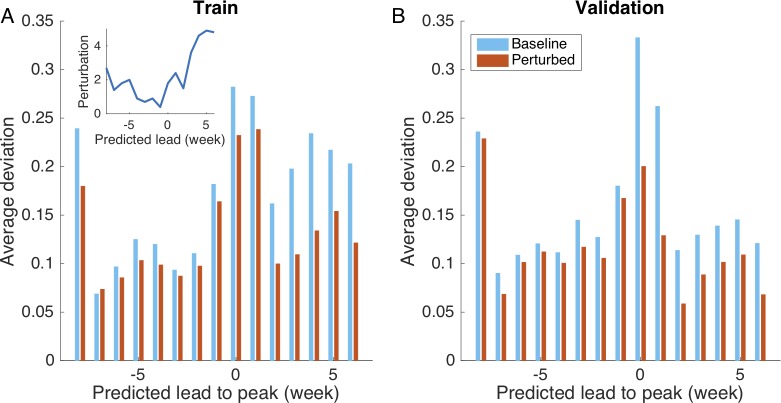
Fig 6. Reduction of deviation in reliability plot achieved by perturbation in retrospective forecast.
We use half of historical outbreaks in 95 US cities during the 2003–2004 through 2013–2014 seasons (excluding the 2008–2009 and 2009–2010 pandemic seasons) to optimize the perturbation intensity in which the deviation of the reliability plot is minimized. Inset shows the optimized perturbation strategy. The comparison of average deviation for baseline and perturbed SIRS-EAKF systems is presented in (A). We validate the perturbation procedure using the other half of historical outbreaks, and report the comparison of average deviation in (B). For both training and validation data, the perturbation procedure (red bars) reduces reliability plot deviation, particularly for predicted leads between 0 and 6 weeks.

