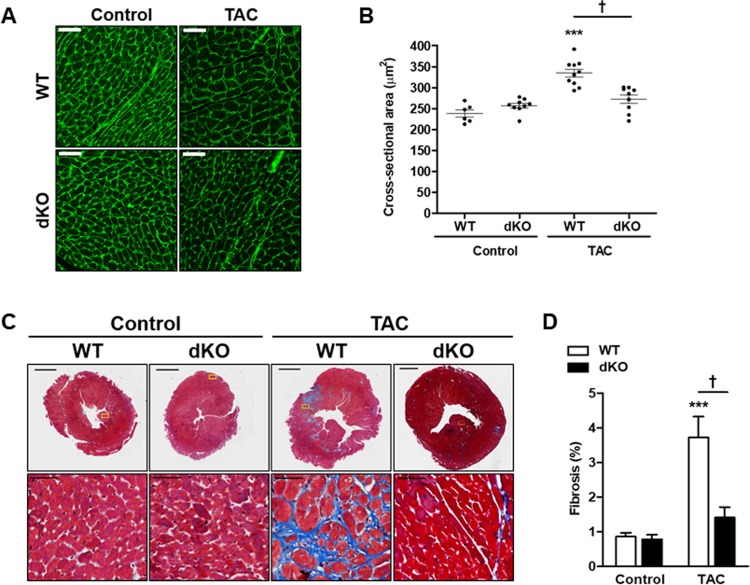
Fig 2. dKO male mice display attenuated cardiac fibrosis following TAC.
Male mice were treated with TAC for 8 weeks and their hearts were analyzed. A Ventricles sections were stained with FITC-labeled wheat germ agglutinin and cell size was analyzed. Scale bar = 100 μm. B Quantification of cell size from D represented as cross sectional area in μm2. C Representative paraffin-embedded heart sections stained with Masson’s trichrome to visualize fibrosis. D Quantification of the level of fibrosis (%) stained by Masson's trichrome (n = 6-8/group). All results represent the mean ± SE ***P ≤ 0.05, control vs. TAC; †P ≤ 0.05, difference between genotypes.

