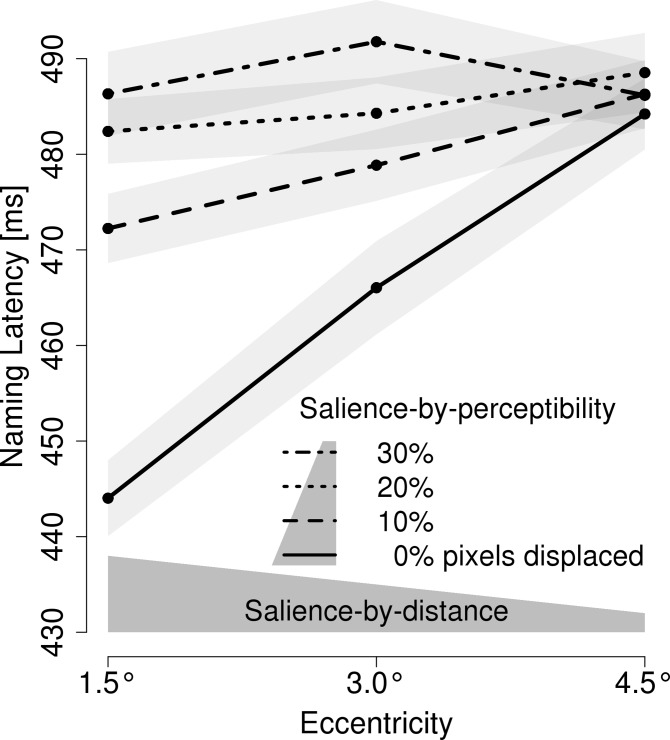
Fig 4. Experiment 3: Mean voice onset latency.
Mean voice onset latencies are depicted in relation to the salience of the preview which was manipulated i.) by eccentricity, that is, the distance from fixation and ii.) by gradually diminishing the visual integrity (i.e., the perceptibility) of the parafoveal preview. The gray polygon above the x-axis illustrates the decreasing salience of the preview with increasing eccentricity. The polygon in the legend illustrates the salience of the preview in relation to its visual integrity. The light-gray areas represent 1 SEM.

