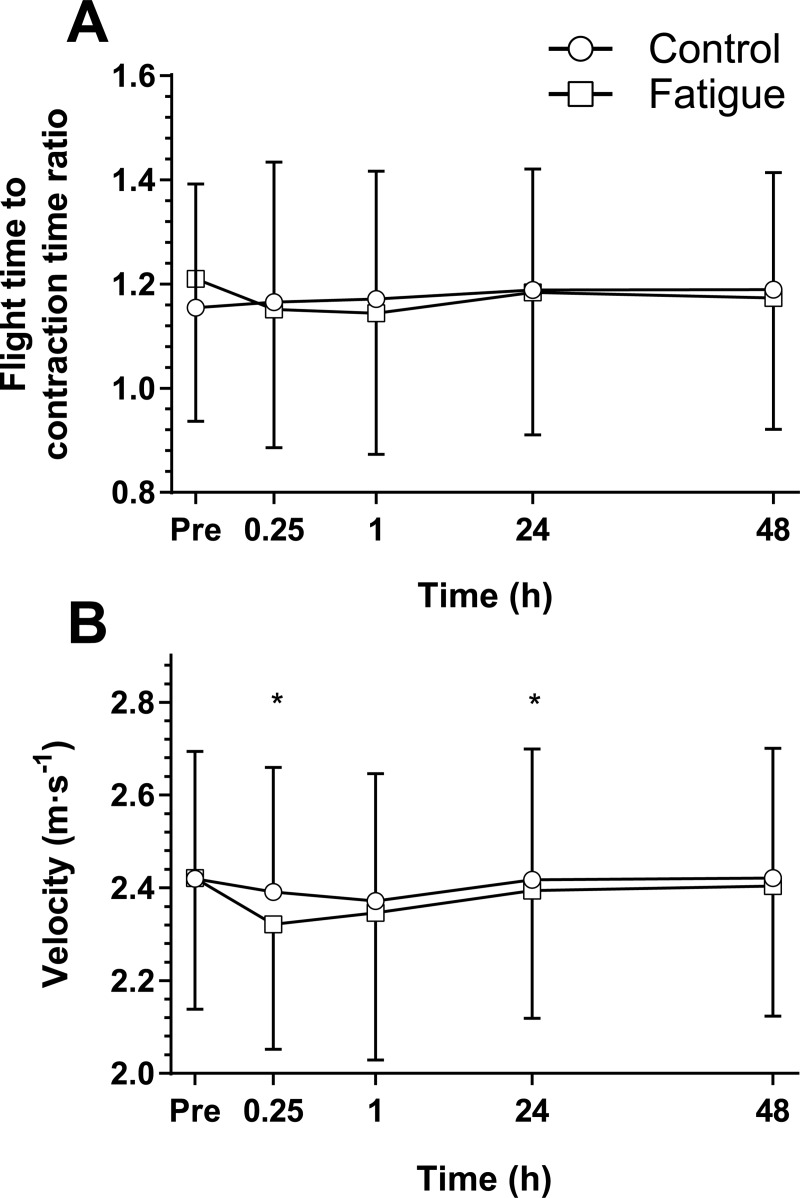
Fig 3. Squat jump results.
The mean (SD) squat jump result (n = 31) for the control (circles) and fatigue interventions (squares) of (A) flight time to contraction time ratio (FT:CT) and (B) peak propulsive (concentric) velocity. Time points from immediately prior (Pre) to 48 h post condition. *Significant (p < 0.05) difference between conditions at the identified time point using a Benjamini-Hochberg post hoc procedure.

