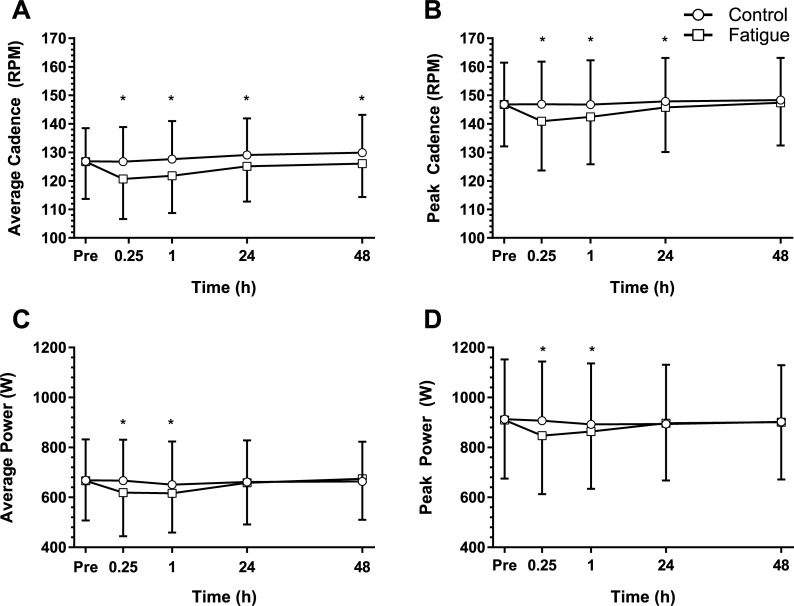
Fig 5. Sprintmax results.
The mean (SD) maximal cycling sprint (Sprintmax) result (n = 30) for the control (circles) and fatigue interventions (squares) of (A) sprint average cadence, (B) sprint peak cadence, (C) sprint average power and (D) sprint peak power variables. Time points from immediately prior (Pre) to 48 h post condition. *Significant (p < 0.05) difference between interventions at the identified time point using a Benjamini-Hochberg post hoc procedure.

