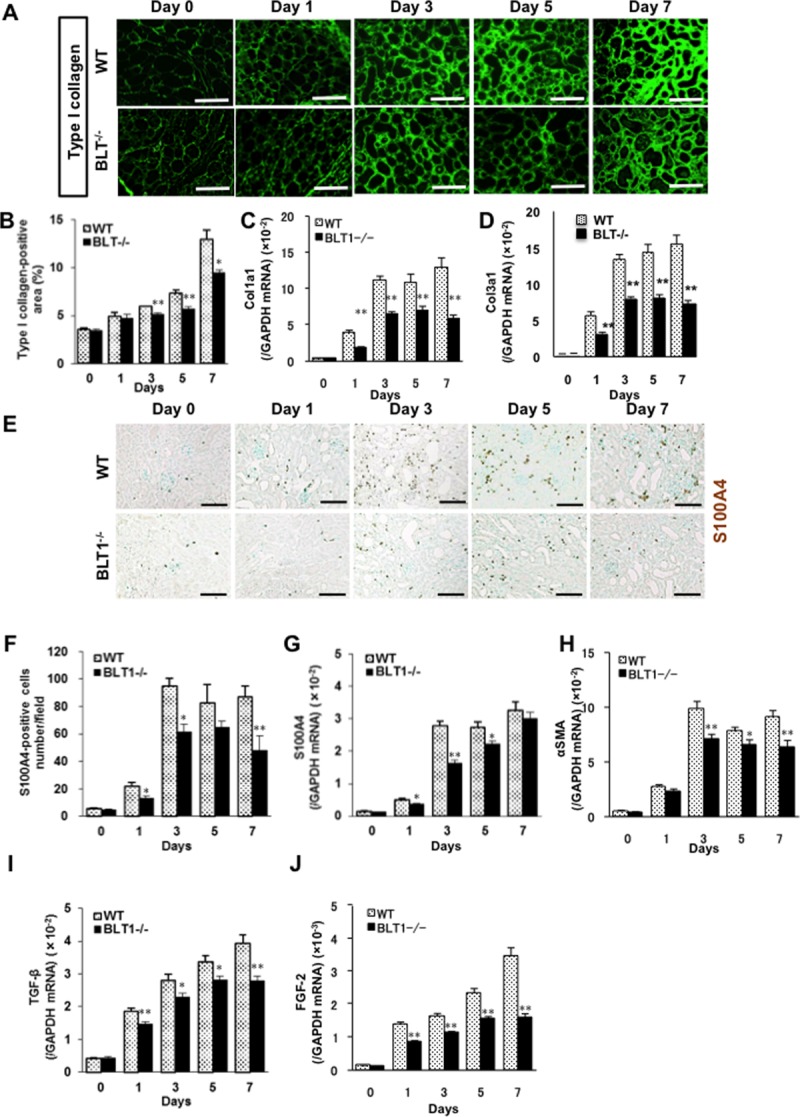
Fig 2. Tubulointerstitial fibrosis is less severe in BLT1-/- mice following UUO.

(A) Representative images of kidney cortex from WT and BLT1-/- mice immunostained with an anti-type I collagen antibody. Scale bars = 50 μm. (B) Temporal changes in the area of immunoreactive collagen within tubulointerstitial spaces (expressed as % total area, excluding glomeruli and large vessels). Data are expressed as the mean ± SEM (n = 4 mice/group). *P<0.05 and **P<0.01, vs. WT. Expression of Col1a1 mRNA (C) and Col3a1 (D) mRNA in WT and BLT1-/- mice kidneys, as measured by real-time PCR. Data are expressed as the mean ± SEM (WT; Day 0: n = 8, Day 1, 3, 5, 7: n = 16 BLT1; Day 0: n = 8, Day 1, 3, 5: n = 16, Day 7: n = 14 mice per group) *P<0.05 and **P<0.01, vs. WT. (D) Representative images showing S100A4 staining in WT and BLT1-/- kidneys after UUO. Scale bars = 100 μm. (E) Changes in the number of S100A4-positive cells in WT UUO and BLT1-/- UUO kidneys. (F) The number of S100A4-positive cells was significantly lower in BLT1-/- UUO kidneys. Data are expressed as the mean ± SEM (n = 4 mice/group). (G, H) Expression of mRNA encoding S100A4 (G) and αSMA (H) in UUO kidneys, as measured by real-time PCR. Data are expressed as the mean ± SEM (WT; Day 0: n = 7, Day 1: n = 12, Day 3, 5, 7: n = 18 BLT1; Day 0: n = 7, Day 1: n = 12, Day 3, 5: n = 16, Day 7: n = 18 mice per group). *P<0.05 and **P<0.01, vs. WT. H, I) Expression of mRNA encoding TGF-β (I) and FGF-2 (J) in mouse kidneys after induction of UUO. Data are expressed as the mean ± SEM (TGF-β: WT; Day 0: n = 8, Day 1: n = 16, Day 3, 5, 7: n = 20 BLT1; Day 0: n = 8, Day 1: n = 14, Day 3, 5: n = 20, Day7: n = 18 mice per group. FGF-2: WT; Day 0: n = 8, Day 1, 3, 5, 7: n = 16 BLT1; Day 0: n = 8, Day 1, 3, 5, 7: n = 16 mice per group). *P<0.05 and **P<0.01, vs. WT mice.
