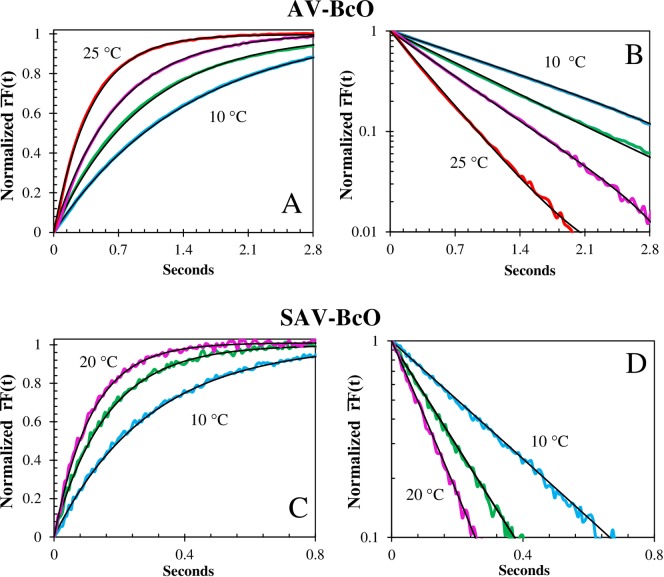
Fig 4. Temperature dependence of the association traces of BcO binding to AV and SAV.
(A) Normalized fluorescence anisotropy, , temperature dependence of BcO (20 nM) binding to AV (260 nM) at pH 8, normalized as [rF(0) − rF(t)]/[rF(0) − rF(∞)]. The observed (color) and fitted (black line) curves at 25°C (top), 20°C (upper middle) and 15°C (lower middle) and 10°C (bottom) had half-times of 280 ms, 452 ms, 695 ms and 1024 ms, respectively; and (B) shows the corresponding semi-logarithmic plot of . (C) Normalized fluorescence anisotropy, , shows a temperature dependence of BcO (20 nM) binding to SAV (200 nM) at pH 8, normalized as above (4A). The observed (color) and fitted (black line) curves at 20°C (top), 15°C (middle) and 10°C (bottom) had half-times of 79 ms, 111 ms and 202 ms, respectively and (D) shows the corresponding semi-logarithmic plot of the .

