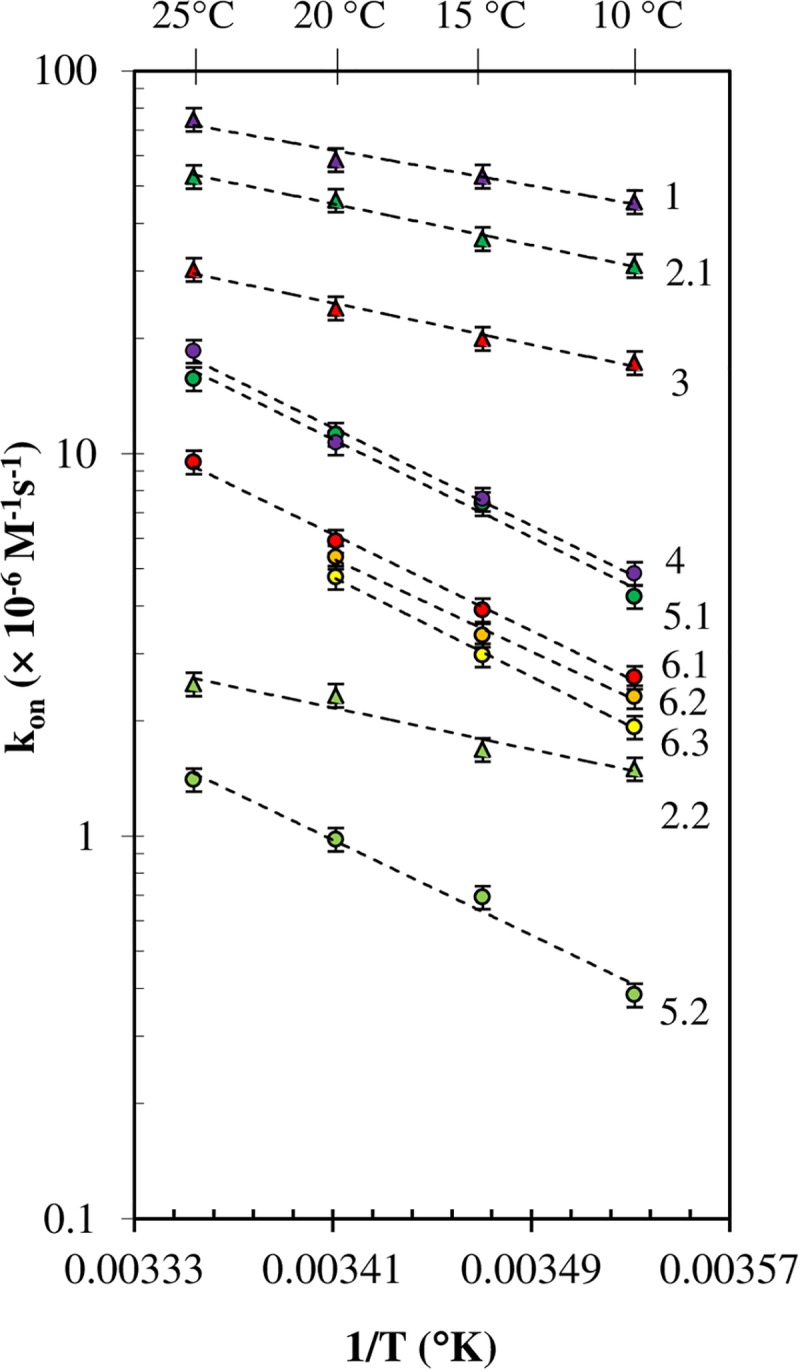
Fig 8. Arrhenius plot of the association rate constants.

Temperature dependence of the B7 association reaction at pH 8 (unless otherwise specified) for: 1 SAV-BFl (purple triangles); 2 SAV-B7-DNAds*Fl (green triangles): 2.1 (kon1) and 2.2 (kon2); 3 SAV-BcO (red triangles); 4 AV-BFl (purple circles); 5 AV-B7-DNAds*Fl (green circles): 5.1 (kon1) and 5.2 (kon2); 6 AV-BcO (red circles): 6.1 at pH 8, 6.2 at pH 9 (orange circles), 6.3 at pH 10 (yellow circles). The data points were plotted in semi-logarithm (ln kon vs 1/T) for clarity.
